Bridge Modeling in HEC-RAS 2D – 2D Pressure/Overtopping Approach
Since HEC-RAS 6.7, a more detailed 2D bridge modeling method has been introduced – 2D Pressure/Overtopping Approach. Different from the Simplified 1D Rating Curves Approach, this new physics-based “cloned mesh” approach relying on refined 2D meshes and a high resolution terrain which incorporates bridge piers and abutment geometries to resolve the details of the bridge hydraulics (Figure 1). The Simplified 1D Rating Curves method is ideal for large-scale regional models where precise velocity results near the structure are not a priority. Conversely, the 2D Pressure/Overtopping approach is better suited for high-resolution local models where a refined mesh can capture bridge piers and abutments for a complex flow dynamics. The 2D Pressure/Overtopping bridge modeling approach does not work with the 2D Diffusion Wave solver.
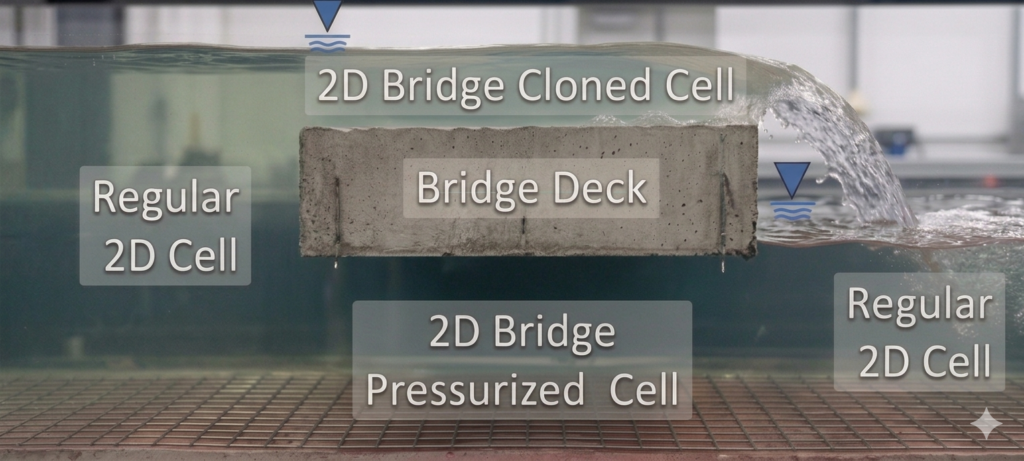
The 2D bridge will be created as a SA/2D Connection with its structure type as 2D Bridge with Pressure/Overtopping (draw 2D Connection line from left to right when facing downstream flow direction). Enforce the 2D connection as a breakline to refine a normal 2D computational mesh in the bridge area as usually. The 2D cells and its faces under the bridge should match the bridge deck edges exactly so the “cloned” upper 2D cell layer represents the bridge deck more closely. At runtime, the computational engine (shallow water equation) automatically copies the mesh cells/faces beneath the bridge and places this duplicate layer on top of the bridge deck. This creates a two-layer 2D model vertically stacked at the bridge location:
- Lower layer – Flow through the bridge opening (can become pressurized)
- Upper layer – Flow over the bridge deck (overtopping)
In 2D Connection Data Editor, Only the Bridge Deck data and 2D Bridge Param need to be entered (Figure 2). The bridge pier and abutment data entry is optional since the data will only be used for reference in the bridge scour calculations.

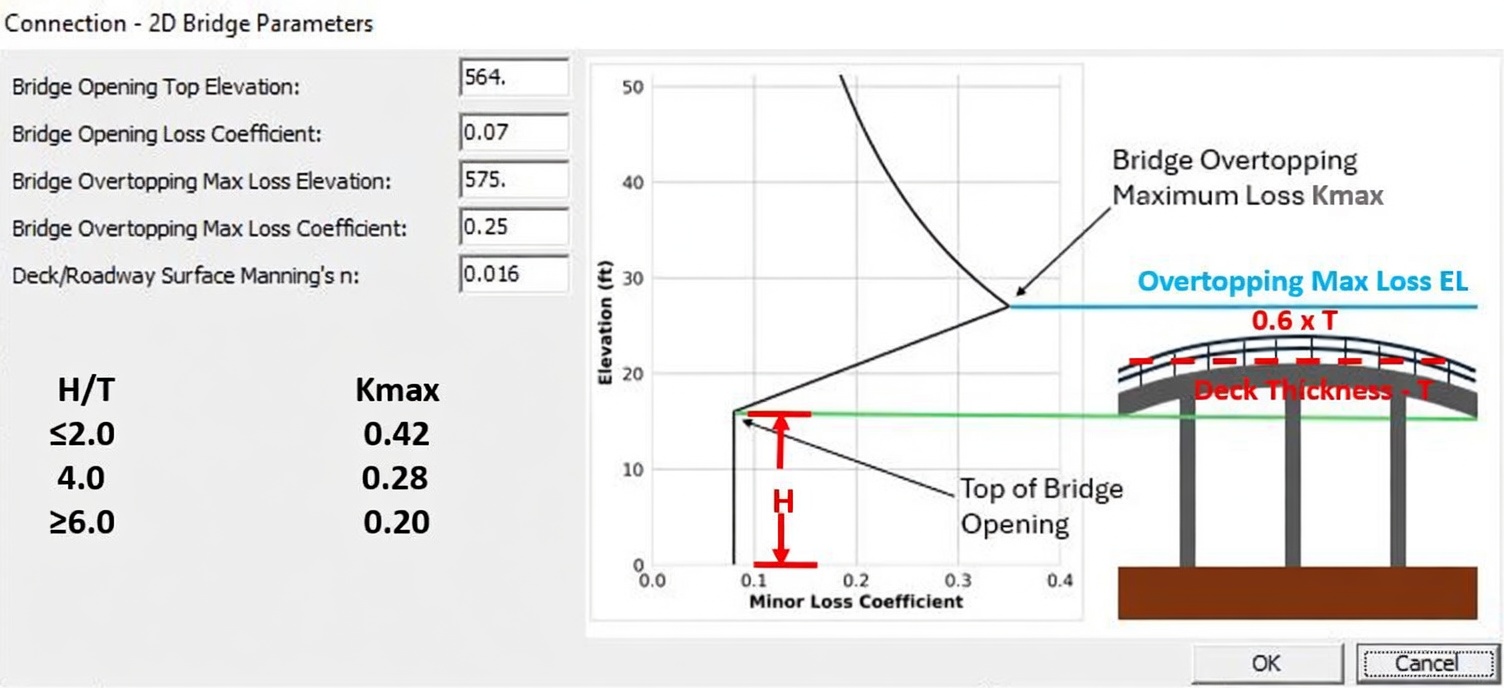
2D Bridge Param is for Minor Loss Coefficient calculation (Figure 3). HEC-RAS uses the Minor Loss Coefficient to account for energy losses through the bridge in the 2D Pressure/Overtopping method, which was first introduced by TUFLOW 2D Bridge Modeling Method. Acoording to TUFLOW documentation, the minimum K (energy loss due to piers) is 0.07 and the Kmax depends on H/T as shown in Figure 3. TUFLOW suggests that the solid portion of the bridge guard rails be added to the bridge deck thickness T to calculate H/T. A minimum K anywhere between 0.05 and 0.08 is probably still reasonable depending on different site conditions and it should be a good candidate for model calibration.
The bridge piers and abutments need be “burned” into the terrain using Terrain Modification Tool in RAS Mapper and their elevations should be set as high as the top of the bridge deck. To help locate the piers locations in RAS Mapper, in 2D Connection Data Editor (Figure 2), piers stations should be provided as shown in Figure 4.

A refined cell meshing scheme should be employed in the bridge pier or abutment location so their existence can be “seen” by the 2D solver. It is important to make sure a pier or an abutment intersects with cell faces. In Figure 5, the cell size around the pier centerline breakline is 10ft x 10ft and the cell size enforced by the 2D Connection bridge centerline is 20ft x 20ft. It is considered an acceptable meshing scheme in the bridge deck and pier area for 2D Pressure/Overtopping Approach without resorting to many tiny cells. Figure 5 meshing scheme is achieved by enforcing the pier centerline breakline first (enable 1 Cell Protection Radius), then followed by enforcing the 2D connection line.

In Figure 6, the velocity particle tracing map clearly shows there is no flow inside the pier as expected.

The new profile view window is able to show the bridge structure (Figure 7) where the profile line is cut along the river centerline.

The traditional HEC-RAS bridge model Cross Section 3 and 2 do not have an impact on bridge hydraulic calculation in the 2D Pressure/Overtopping Approach. Their existence is used to define the HW and TW locations for result presentation purpose (Figure 8).

HEC-RAS has two primary methods for modeling bridges within 2D flow areas, each suited to different project scales. In practice, engineers typically begin with the 1D rating curves method when building large-scale models. This approach ensures the model runs reliably and produces sensible overall hydraulics across broad river reaches or entire watersheds. Once the base model is stable, critical bridges can be selectively upgraded to the more advanced 2D Pressure/Overtopping method with targeted local mesh refinements. This upgrade is applied where the extra effort is justified – such as detailed scour analysis, environmental impact studies, or regulatory requirements.
This hybrid philosophy delivers both large-scale efficiency and localized accuracy while staying within practical computational budgets. A common workflow involves running the large-scale model using 1D rating curves for initial screening and broad results. Boundary conditions are then extracted and applied to a refined, zoomed-in local 2D model that employs the 2D Pressure/Overtopping method with a finer mesh.
Leave a Reply