HEC-HMS Calibration Using Optimization Trial Runs
Two calibration methods are available in HEC-HMS: semi-automatic calibration using computation points and automatic calibration using optimization trial runs. This post is to focus on calibration by optimization trial runs. Calibration by computation points can found here.
Calibration using optimization trial runs is pretty straightforward: in order to match the modeling results with a set of observed data set, HEC-HMS will automatically adjust parameters selected by the modeler to minimize the difference between the two data sets. The difference between the two data sets is to represented by some statistic functions, such as Mean of Absolute Residuals, Root Mean Square Error (RMSE), and Peak-Weighted RMSE.
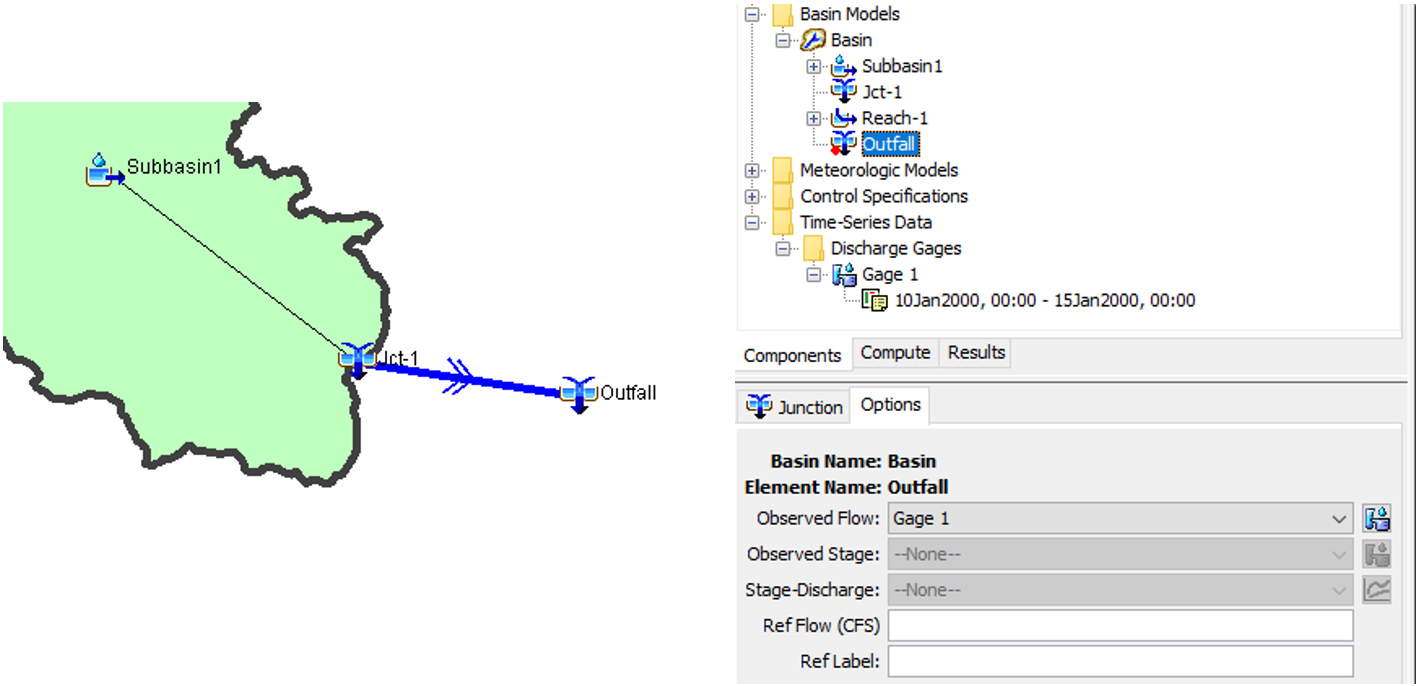
A simple HEC-HMS model set up is shown on Figure 1 with a discharge gage (Gage1) being assigned to Outfall. The calibration will be done by comparing the modeled flow hydrograph at Outfall with the discharge gage via Optimization Trial(Figure 2).
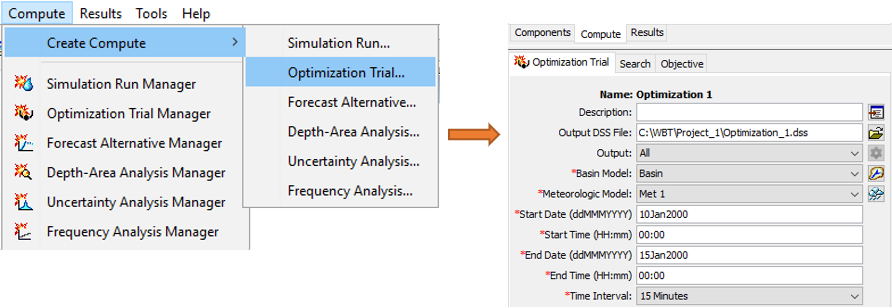
Under the Search Tab of Figure 2, maximum iterations and tolerance can be entered as desired. The Objective Tab is shown on Figure 4 with the Goal being set up as Minimization.

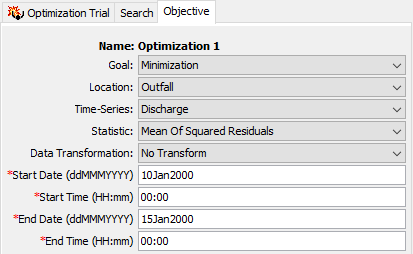
Selection of the statistic functions depends on your modeling purpose. For example, if you only care about peak discharge values, you may want to set the statistic function to be Percent Error in Peak Discharge which doe not account for volume or peak timing; however, if you do want to calibrate peak discharge, volume, and timing, the preferred statistic function is Mean Of Absolute Residuals, Mean Of Squared Residuals, or Peak-Weighted RMSE.
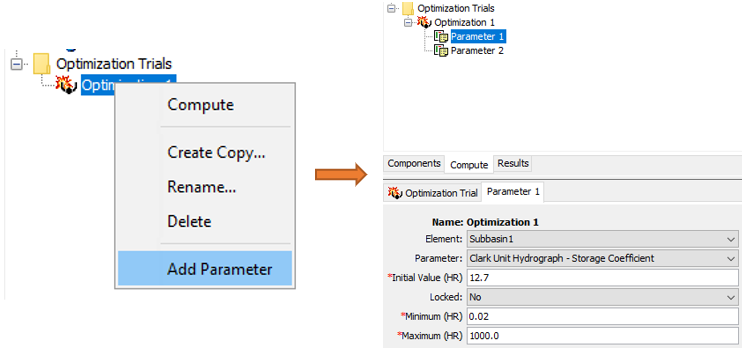
The next step of setting an optimization trial run is to add parameters which will be adjusted automatically by HEC-HMS to minimize the statistic functions. Multiple parameters can be selected for a single optimization trial run.
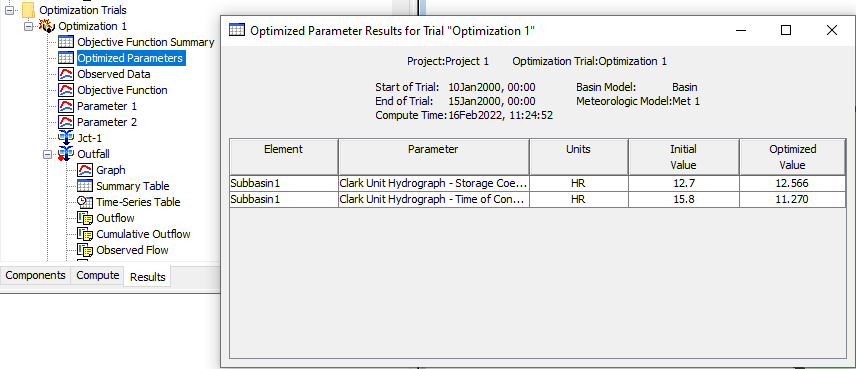
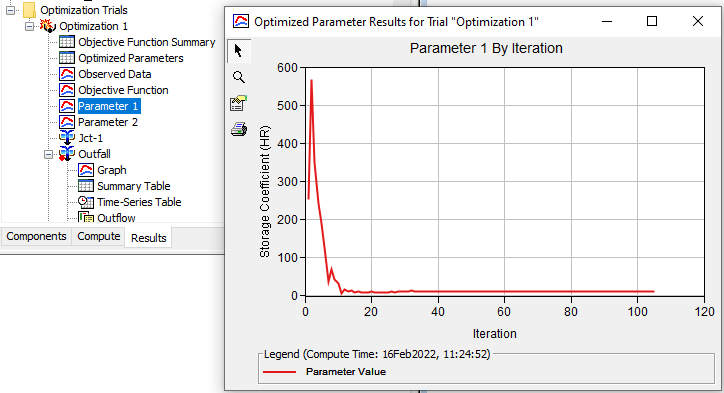
The results of an optimization trial run are available under the Results tab of the HEC-HMS. The optimized parameter values are shown in Figure 6 and its value trending during optimization trial run is shown on Figure 7.
The optimization trial run does NOT update the parameters with the optimized values in the element editors. The modeler will need to manually change the values if satisfied with the calibration results.
Leave a Reply