Sensitivity and Uncertainty Analysis In HEC-HMS
HEC-HMS has long been considered as a deterministic model which produces modeling results such as flow rates and volumes by assuming fixed input. A deterministic hydrology model sometimes could not end up with meaningful results due to uncertainty and variability surrounding the input parameters. The HEC-HMS uncertainty analysis, a Monte Carlo simulation tool, is able to to assign probability distributions to input parameters and evaluate the uncertainty in the simulated watershed response.
To carry out an uncertainty analysis in HEC-HMS requires using tools to capture the probability distributions of hydrologic modeling parameters. Only limited work has been done in this regard, for example, it is generally believed that annual precipitation follows normal distribution and hydraulic conductivity follows lognormal or gamma distribution.
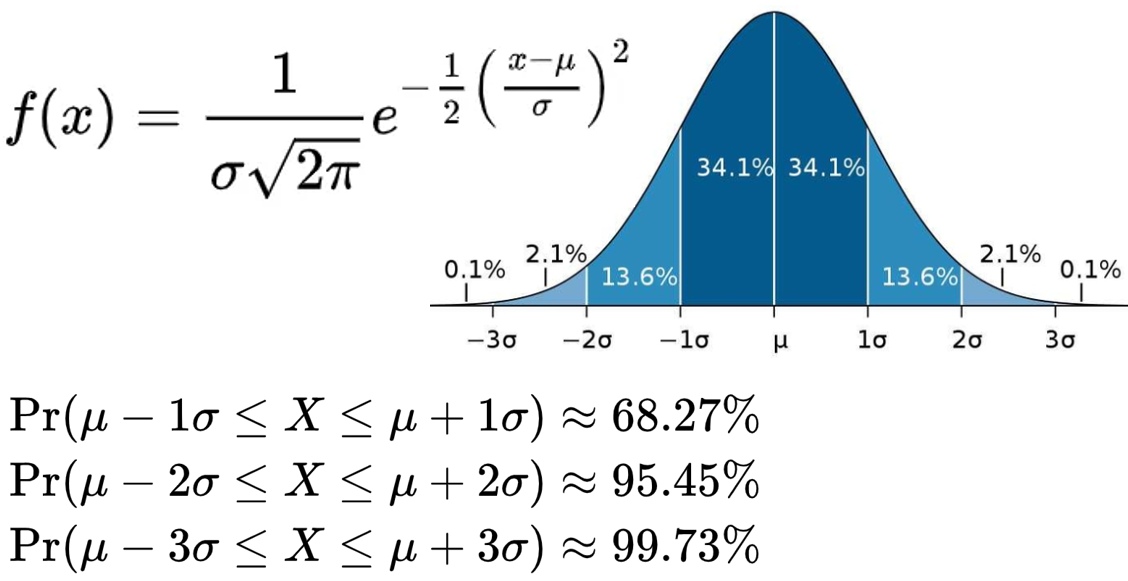
A lot of hydrologic parameters’ distributions may be approximated as a normal distribution due to central limit theorem. According to Figure 1, 99.73% of all of the data is within three standard deviations of the mean, which suggests that an approximation for the minimum value is the mean minus three times the standard deviation ![]() and for the maximum it is the mean plus three times the standard deviation
and for the maximum it is the mean plus three times the standard deviation ![]() . In a practical engineering problem, if a parameter follows normal distribution and its mean and minimum/maximum value are known, its standard deviation may be estimated as
. In a practical engineering problem, if a parameter follows normal distribution and its mean and minimum/maximum value are known, its standard deviation may be estimated as ![]() . Note that the above approximation is not a strict mathematical solution.
. Note that the above approximation is not a strict mathematical solution.
Another easy-to-use probability distribution is the uniform distribution in which every value between the lower bound a and upper bound b is equally likely to occur and any value outside the bounds has a probability of zero (Figure 2).
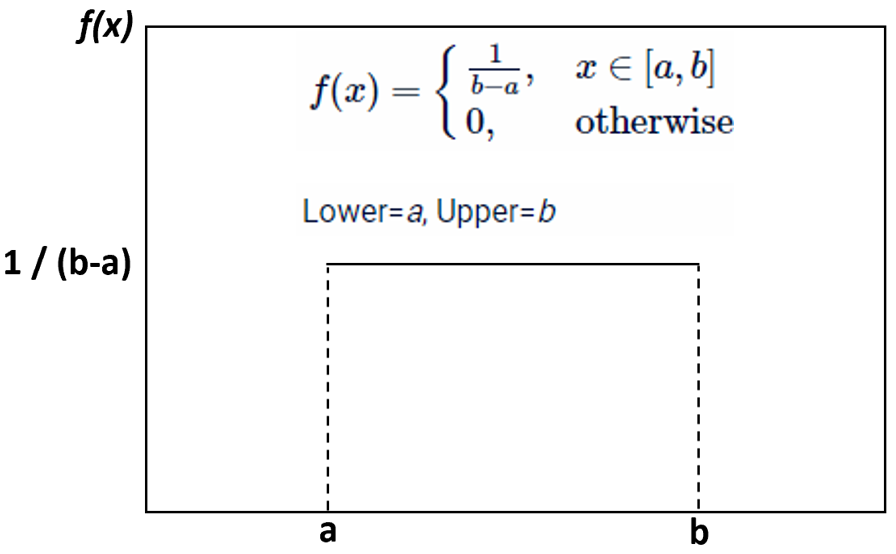
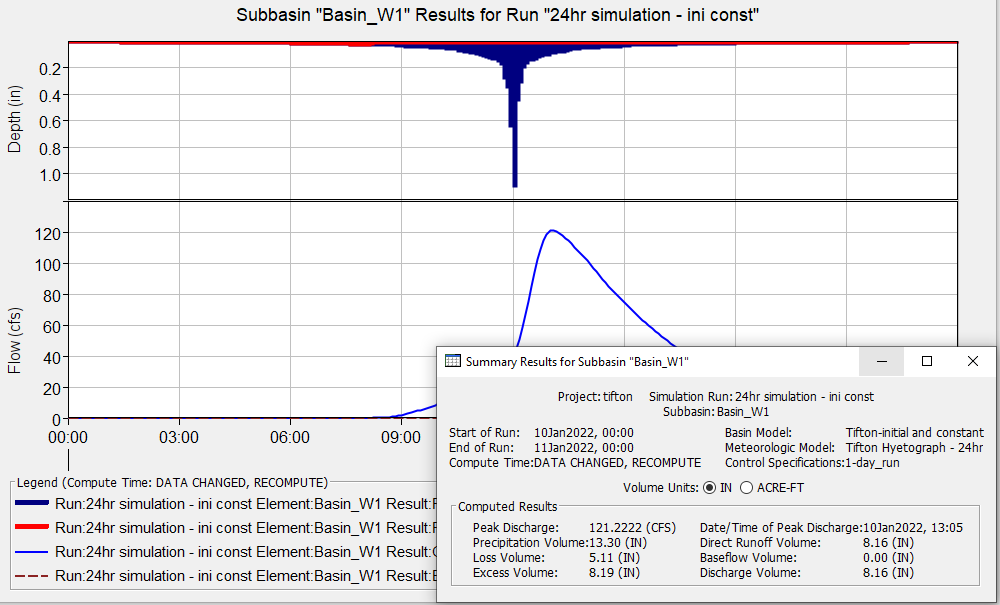
The uniform distribution only requires two values a and b as the minimum and maximum so it can be used to perform a sensitivity analysis via HEC-HMS Uncertainty Analysis to observe a watershed response (for example, flow rate) to parameters varying between a and b. A simple HEC-HMS model was established to study the sensitivity of initial loss of Initial and Constant loss method. The model only consists of a 64-ac subbasin (Basin_W1)with Initial and Constant as loss method (Initial Loss=2.0 inch and Constant Rate=0.2 inch/hr) and Clark UH as transform method (TOC=1.0hr and Storage R=2.0hr). A 24-hr model run was conducted using 24-hr 100-yr frequency storm and the result is shown in Figure 3.
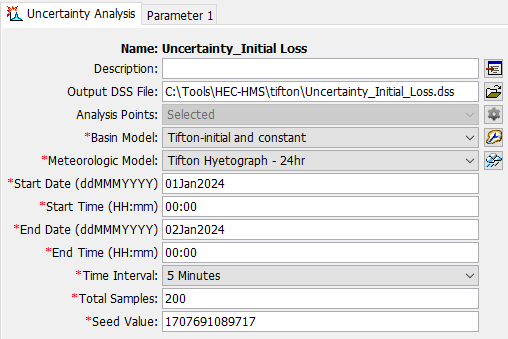
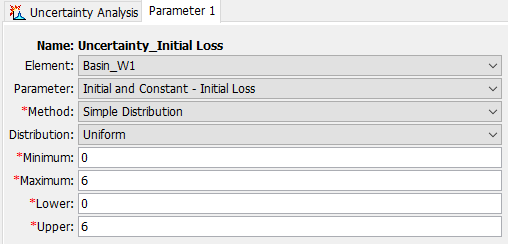
To evaluate the sensitivity of initial loss, an uncertainty analysis was created by assuming the initial loss follows uniform distribution with min/lower=0.0 inch and the max/upper=6.0 inch (Figure 4 and Figure 5). The total sample number is 200 for this test.
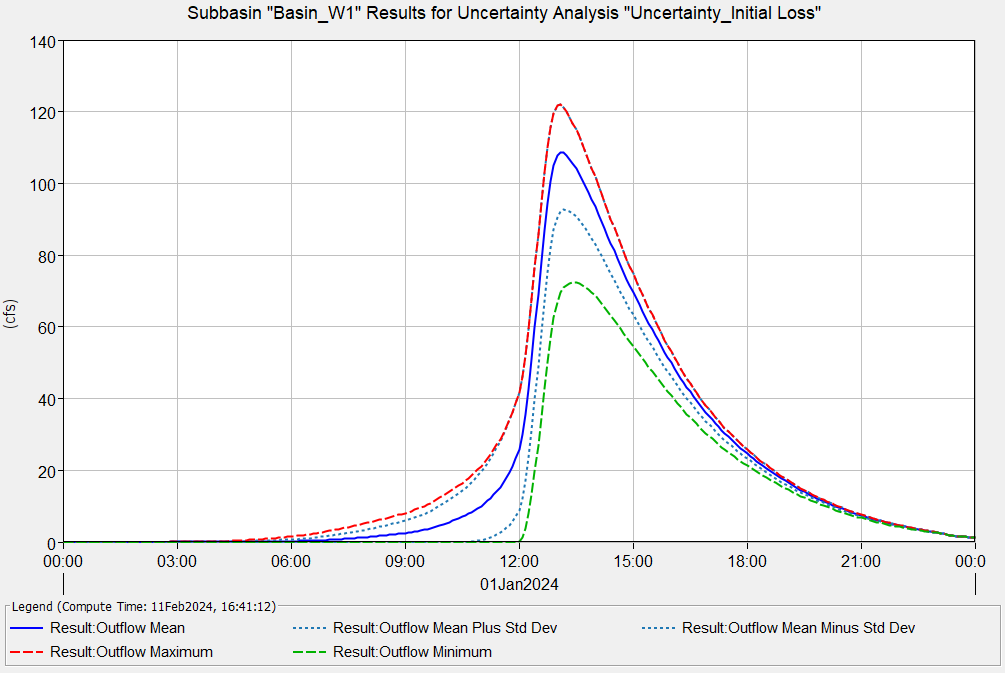
Basin_W1 flow hydrographs of the uncertainty analysis are shown in Figure 6.
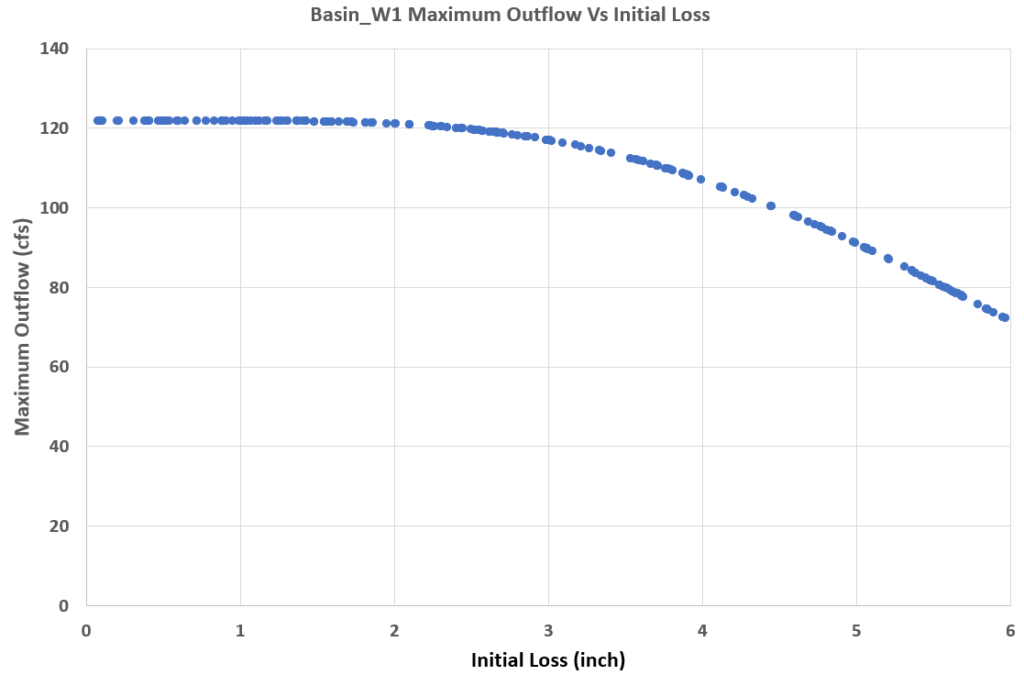
Copy 200 (total sample number of this demonstration) initial loss values and the corresponding 200 maximum outflows to Excel and create a relationship chart (Figure 7). It is obvious that for Basin_W1, when the initial loss is between 0.0 and 2.0 inch, the maximum outflow is not sensitive to its value; however, when the initial loss is greater than 2.0 inch, the maximum outflow starts to become sensitive.
A major obstacle limiting the HEC-HMS uncertainty analysis’s application is the lack of understanding on probability distributions of hydrologic parameters. Hopefully more relevant studies can be done in the future to fully take advantage of this useful HEC-HMS feature.
Leave a Reply