HEC-HMS Calibration Using Computation Point
Two calibration methods are available in HEC-HMS: semi-automatic calibration using computation points and automatic calibration using optimization trial runs. This post is to focus on computation point calibration. Calibration by optimization trial runs can found here.
A hydrologic element in HEC-HMS (a reach, a reservoir, a junction, or a subbasin) can be selected as a computation point if the element has an observed data set associated with. By adjusting its own and upstream element parameters, the HEC-HMS results at the computation point can be updated and viewed dynamically to match the observed data. (Note: computation point is also useful when determining an average precipitation depth from a supplied precipitation-frequency depth raster file – refer to this post)
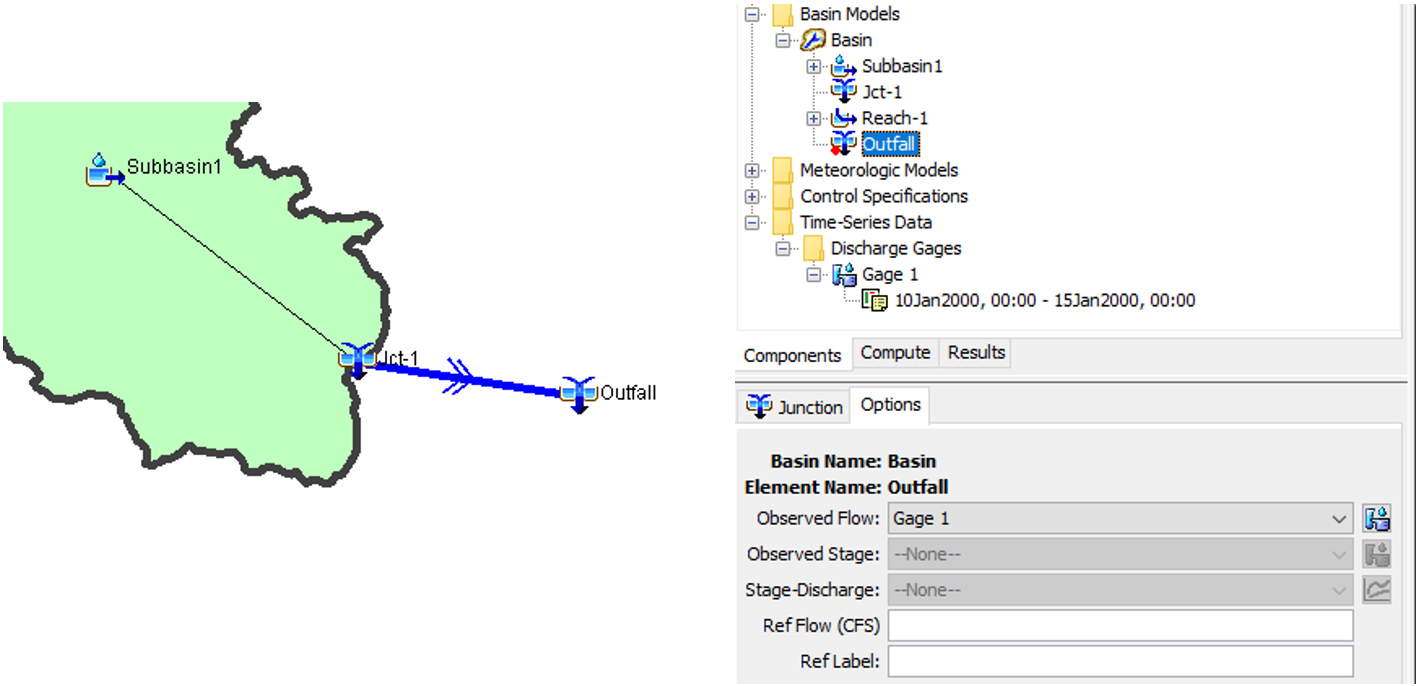
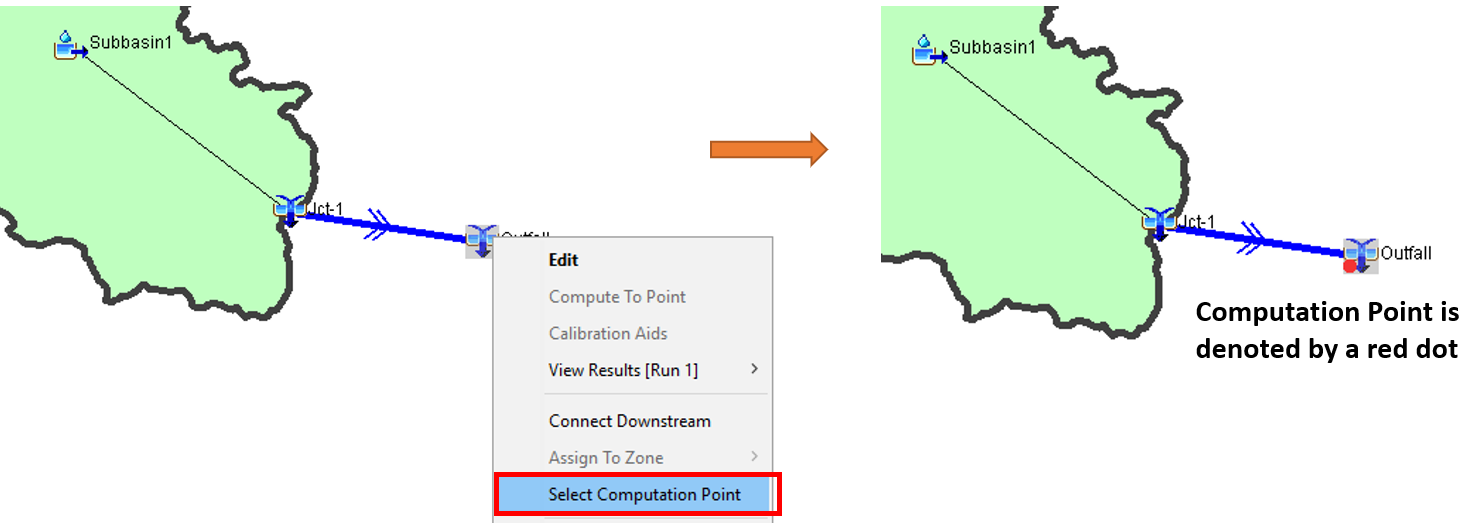
A simple HEC-HMS model set up is shown on Figure 1 with a discharge gage (Gage1) being assigned to Outfall. On Figure 2 Outfall is selected as a computation point in order to calibrate its flows.
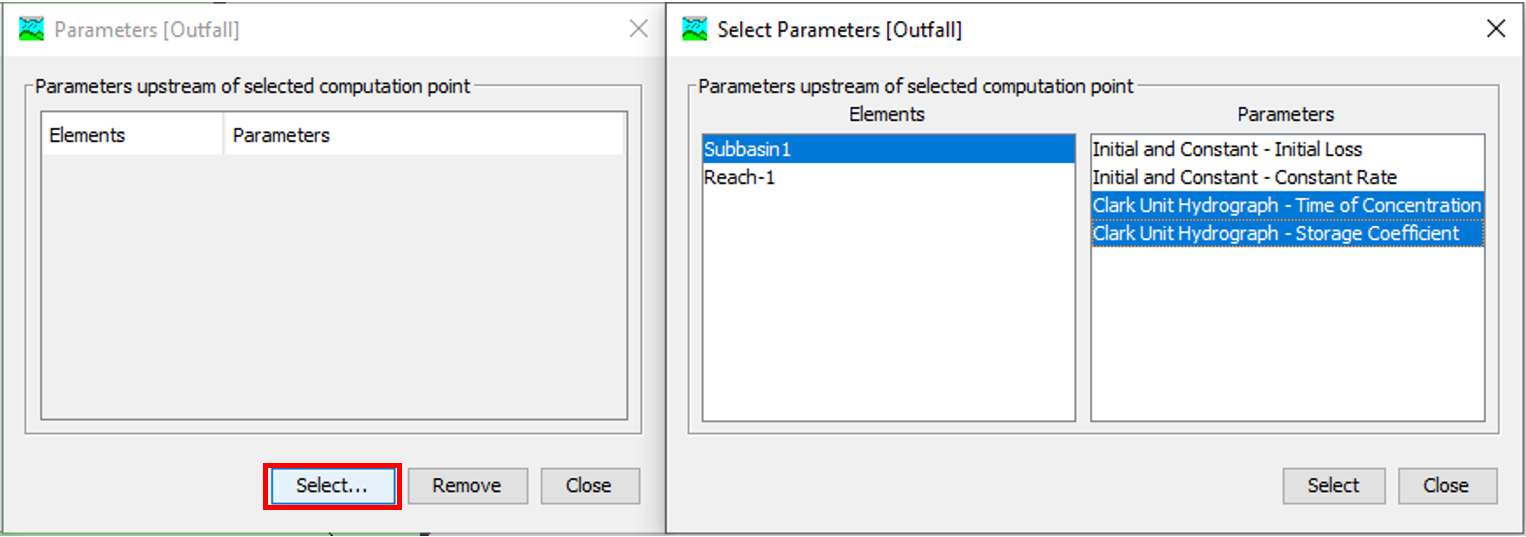
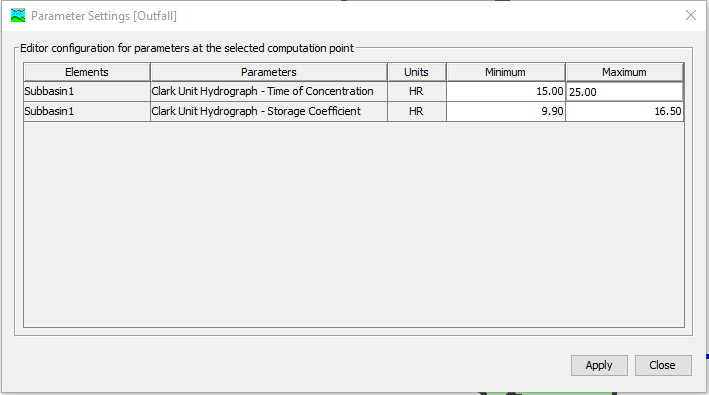
Once an element is defined as a computation point, open Computation Point Manager (Figure 3) from the top menu of Parameters and select hydrologic parameters for calibration (Figure 4). The value ranges of the selected parameters can be entered by clicking “Parameter Settings…” button of Computation Point Manager (Figure 5).
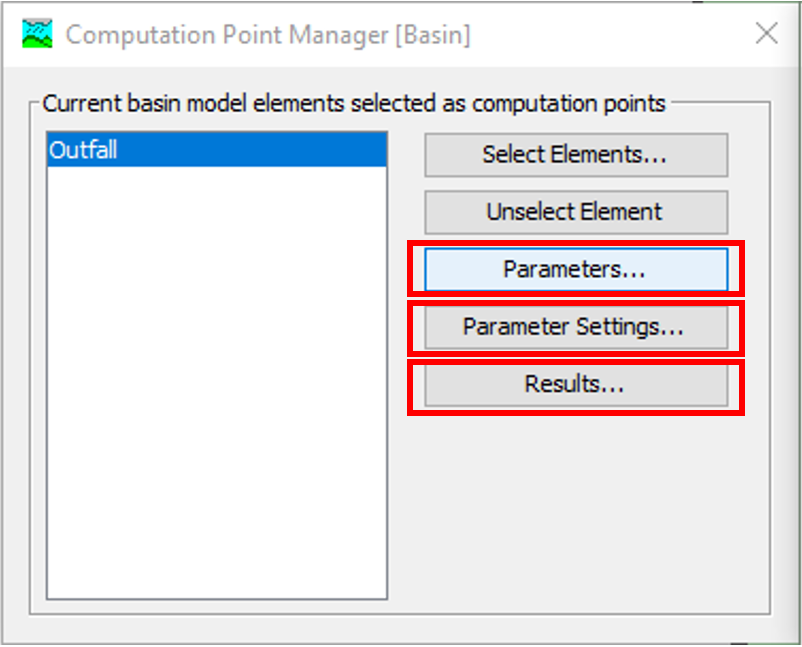
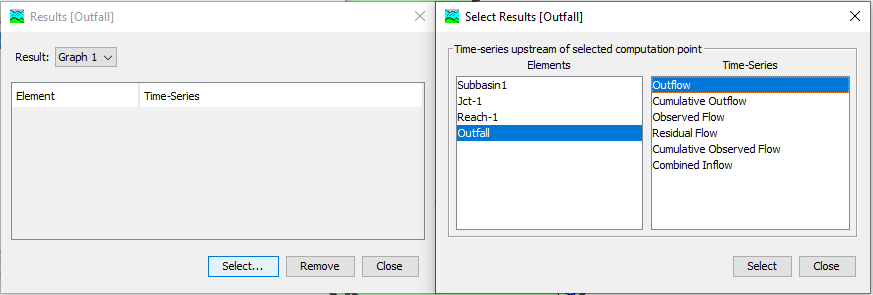
Click the “Results…” button of Computation Point Manager (Figure 3) to select up to five customized time series results from the elements upstream of the computation point including the computation point itself (Figure 6). The time series results are to be shown in graphs and will be updated automatically when adjustments are made to the calibration parameters selected on Figure 4.
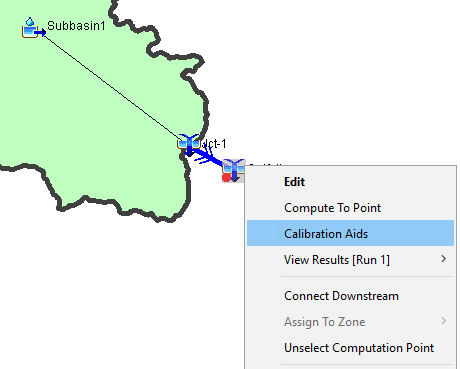
After a normal simulation run is finished, right click the computation point and select Calibration Aids (Figure 7) to open the slider bar of Calibration Editor window (Figure 8). Not only are the time series results in graphs updated automatically, but also the actual parameters in the element editors are to be changed (Figure 9). To discard the changes of the parameters, click the “Reset” button on Figure 9 before closing the Calibration Editor window.
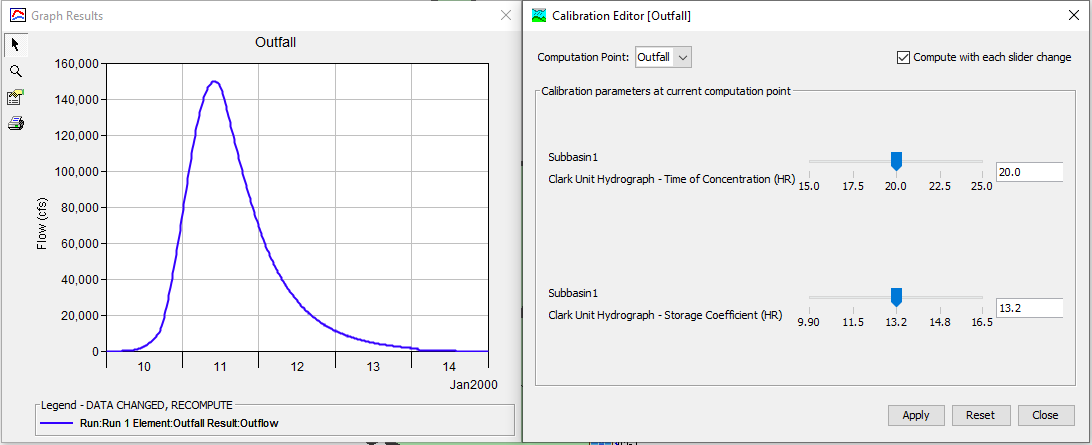
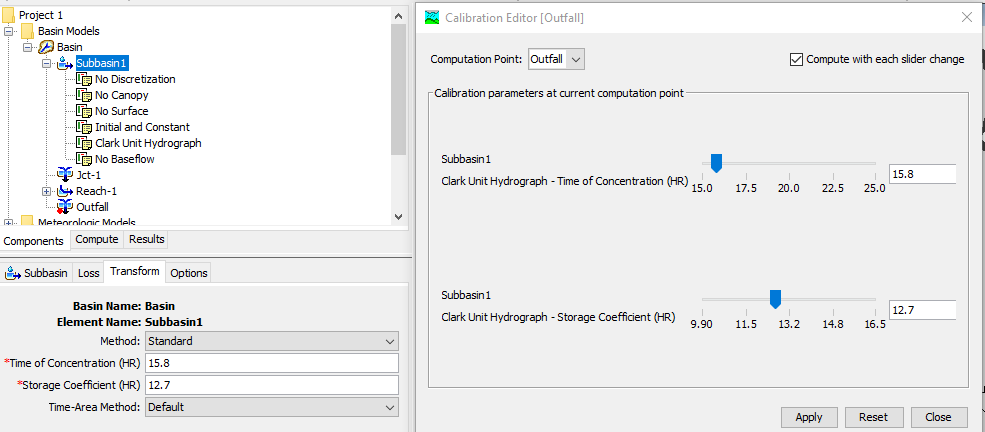
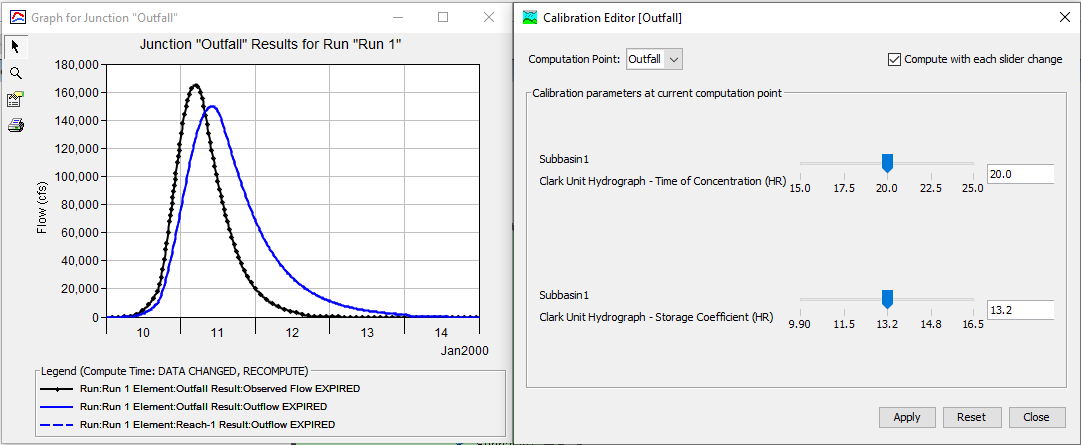
To aid the calibration process, the result graphs together with the observed data set under “Results” tab of HEC-HMS can be arranged by the side of the Calibration Editor window (Figure 10). The result graph on Figure 10 will be updated dynamically with the adjustment of calibration parameters and a better match to the observed data set can be achieved by trial and error (Figure 11).
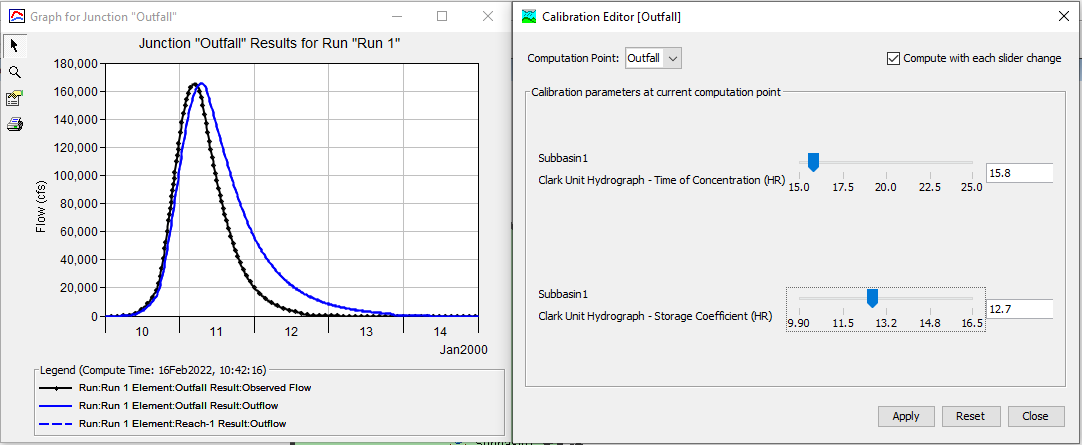
As illustrated above, a semi-automatic calibration can be done in HEC-HMS by defining computation points and eyeball checking the modeling results against the observed data set in a normal simulation run. For automatic calibration in HEC-HMS using optimization trial runs, refer to this post.
Leave a Reply