Raster DEM Slope Calculation Using GIS Slope Tool
A watershed average slope value is often needed in some hydrologic calculations, for example, Time of Concentration (TOC) estimation using NRCS Lag Time Method. The slope tool in AcrGIS or QGIS is usually used to create a slope raster file from a raster DEM which should be in a projected coordinate system. To get the average slope value over a watershed region (or a polygon), use the the zonal statistics tool in GIS to get the mean value.
1. Create a slope raster file using Slope tool.
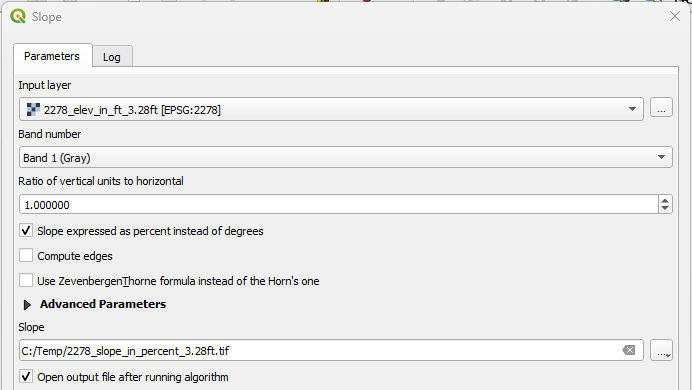
First load the raster DEM file to QGIS and use the Slope tool to create a slope raster file (Figure 1). The math behind raster DEM slope calculation is explained here by ArcGIS. It is a good practice to convert the DEM vertical unit to the same one used by its projection system before calculating the slopes. In Figure 1, if the vertical unit were meter instead of foot for the DEM raster input layer file, the Ratio of vertical units to horizontal should be typed in as 0.3048.

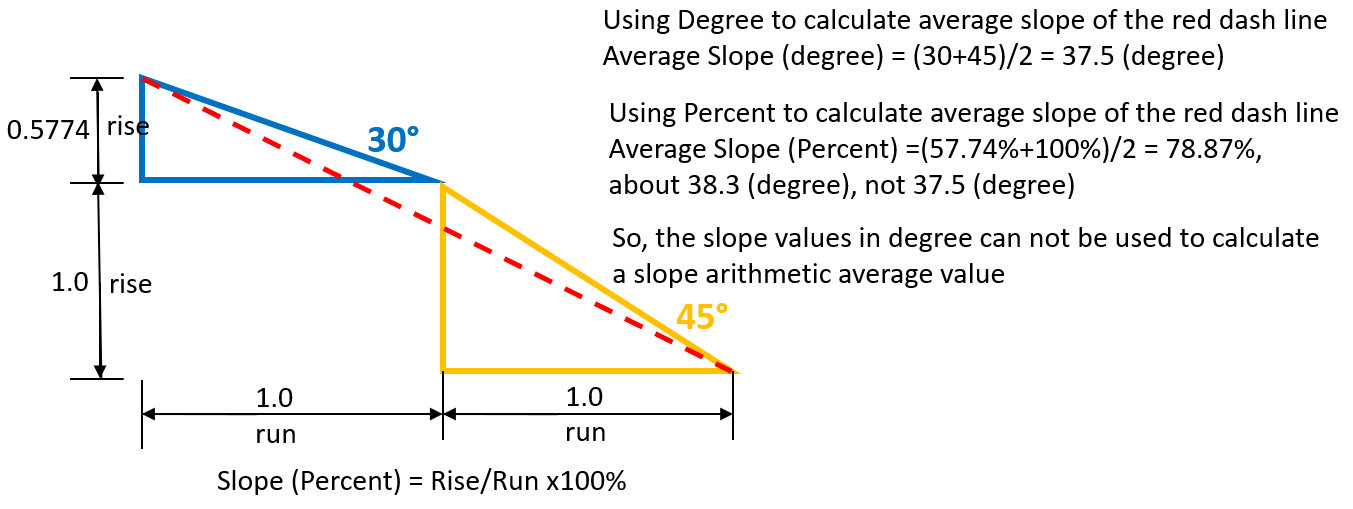
To calculate an average slope at next step, in Figure 1 the slope data type should be set as Percent instead of Degree. As explained in Figure 2 below, it does not make sense to calculate an arithmetic average slope value using slopes in Degree.

2. Calculate a watershed average slope value
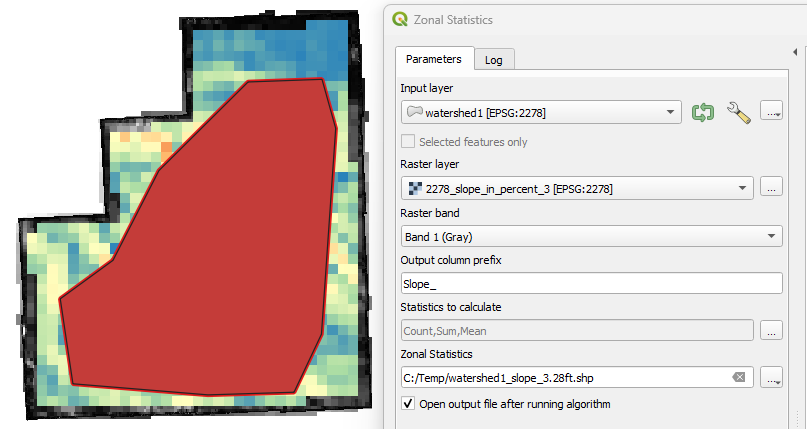
The zonal statistics tool is used to calculate an average slope value over a watershed polygon from the slope raster file created above using the watershed polygon shapefile as input layer (Figure 3). The new shapefile attribute table containing the average (mean) slope value is shown in Figure 4: the average slope for watershed1 is 4.45% in this example.


When calculating a watershed average slope value, considerations should be given to the followings:
1. Resample DEM or not
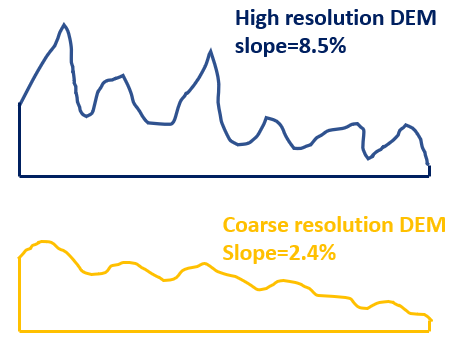
When dealing with a high resolution raster DEM file, sometimes it is preferable to resample the raster DEM file to a coarser resolution to remove the effect of misleading noise or micro-undulations; otherwise, the calculated average slope may be much greater than the hydrologically effective slope of the watershed.

In a set of example data, a 3.28ft (1 meter) resolution raster DEM was resampled to 100ft, 200ft, 400ft, and 600ft resolutions and their corresponding average slopes are summarized and compared in Table 1.

It is going to be a modeler’s judgment call whether or not to resample a high resolution DEM to calculate a watershed average slope and which coarse resolution should to be used for such a purpose.
2. Fill DEM or not
A raster DEM may need to be filled first to create a depressionless DEM before applying the Slope tool to create a slope raster file to reflect the hydrologically effective slopes of a watershed. The finer a DEM resolution is, the greater impact filling DEM is having on slope values. After being filled, the above example DEM with 3.28ft resolution will result in an average watershed slope of 3.40% Vs. 4.45% without being filled; the example DEM with 200ft resolution will end up with an average watershed slope of 1.57% Vs. 1.74% without being filled. The optional DEM filling process is another judgment call that a H&H modeler has to make.
Leave a Reply