Applying Alternating Block Method to Create “Nested” Storm Distributions
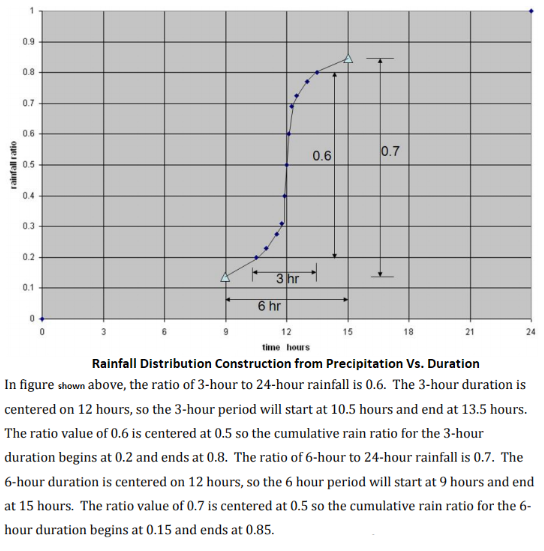
A “nested” design storm distribution, such as SCS Type Type I, IA, II, and III, or the frequency storm in HEC-HMS, is an artificial rainfall distribution using precipitation depth-duration-frequency data. A “nested” storm is not meant to duplicate any actual historical storm distributions, and instead, it is constructed in such a way that any shorter duration depths are “embedded” within the design storm duration with the maximum depth increment being placed at the intended peak intensity position (Figure 1). For this reason, a hydrologic model using a “nested” storm distribution is able to examine a watershed’s performance under various shorter storm durations (up to the storm distribution duration) in a single run.
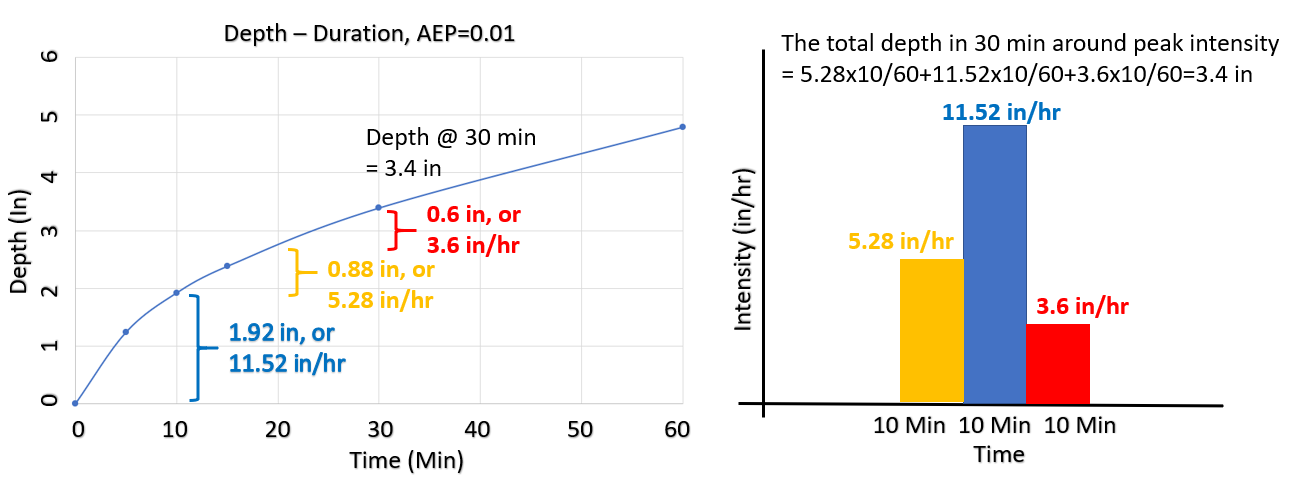
The alternating block method is often used to create “nested ” storm distribution. The precipitation depth increments of each time interval (intensity duration), or blocks, are calculated from Depth-Duration-Frequency curves as shown in Figure 2. The maximum block is to be placed at the intended peak intensity position and the remaining blocks are arranged alternately in descending order before and after the maximum block to form a “nested” storm distribution, AKA a “balanced” storm distribution. In Figure 2, the intensity duration or the block duration time interval is chosen as 10 minutes and the maximum increment of precipitation depth is 1.92 inch or 11.52 in/hr. The 2nd and 3rd biggest increments are 5.28 in/hr and 3.6 in/hr which are placed before and after the maximum increment in the storm distribution.
Depth-duration-frequency (DDF) curve data can be obtained from NOAA Precipitation Frequency Data Server (PFDS) or other regulating agencies. An Intensity-duration-frequency (IDF) curve can be easily converted to DDF, if needed, as illustrated in Figure 3.

The frequency storm in HEC-HMS is a type of “nested” storm distribution generated by Alternating Block Method (refer to this post for more details).
SCS Storm Type I, IA, II, and III are “nested” storm distributions proposed by SCS (now NRCS) decades ago using the precipitation depth data available at that time. Although SCS storm distributions are still widely used today, NRCS is developing or has developed new “nested” storm distributions for different regions in the United States by analyzing the most recent NOAA Atlas 14 precipitation frequency data.
- NOAA Atlas 14 Rainfall Distributions for Ohio Valley and Neighboring States (2011)
- NOAA Atlas 14 Rainfall Distributions for Midwest and Southeast States (2015)
As explained in this post, the new NRCS storm distributions utilizing NOAA Atlas 14 precipitation frequency data should not be confused with the NOAA Atlas 14 temporal distribution which is based on historical storm event statistical analysis.
The Alternating Block Method has also been applied to generate temporal distribution for PMP storms including HMR 52 and 2019 Regional PMP Study for LA, MS, OK and AR. Unlike the frequency storm in HEC-HMS or NRCS (SCS) “nested” storm distributions, no further areal reduction should be applied to PMP depths since those depths are calculated after taking into account basin drainage areas.
Other factors to consider when developing and applying a “nested” storm distribution to a hydrologic model:
- Usually 24-hr “nested” storm distributions are adequate for most applications where the basin time of concentration is 24 hours or less. If needed, a longer duration “nested” storm distribution can be developed following the Alternating Block Method introduced above.
- The intensity duration (or block duration) could be set as the same value of the hydrologic model time step which usually ranges from 5 min, 10 min, or 15 min to 1 hour.
- The peak intensity position is normally at 50% of the storm duration (the peak will appear at 12th hour for a 24-hour storm). Other positions may be required to better describe local storm patterns, for example, using 25% or 33% position for a front-loaded storm, or 67% or 75% position for a back-loaded storm.
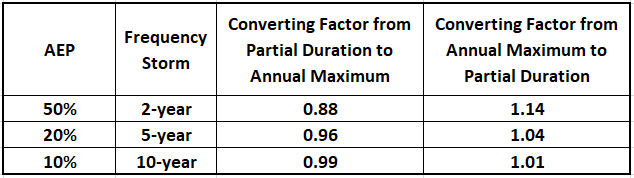
- Usually partial duration series generates greater values than annual maximum series of the same frequency (i.e., partial duration depth > annual maximum depth, Table 1). As the annual exceedance probability decreases (less frequent than 10-year event), the difference between annual maximum and partial duration data becomes negligible.
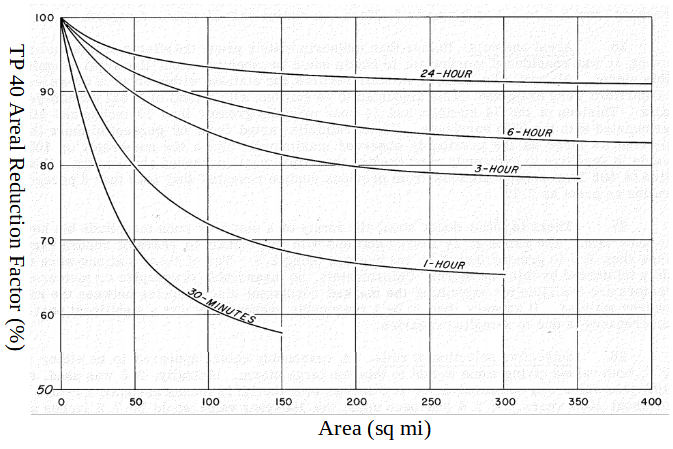
- An areal reduction factor should be applied for basin drainage areas larger than 10 square miles to effectively reduce point precipitation depths. PMP depths usually should NOT be further reduced by an areal reduction factor. TP 40 areal reduction factor (Figure 4) is still commonly used even though it was developed half century ago. Some new regional areal reduction relationships have become available recently which utilize the most recent precipitation depth data, such as the 2016 Study done by NWS Lower Mississippi River Forecast Center (Figure 5).

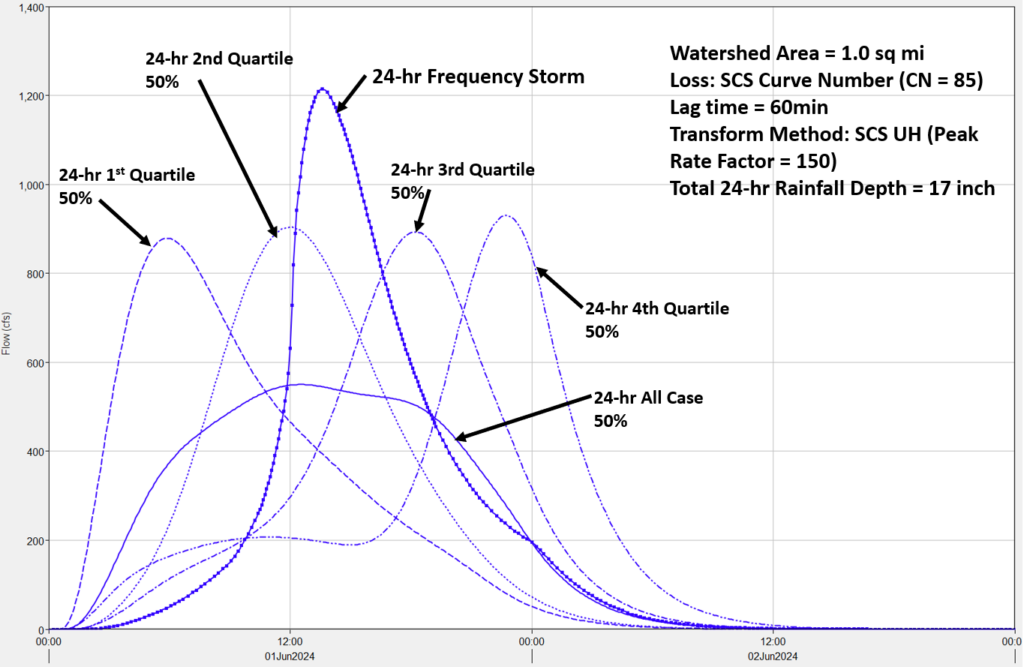
It is worth noting that a frequency storm is a hypothetical storm which is built with the goal of nesting the rainfall depths of different duration in a single hyetograph. In a real world, a frequency storm can never happen and the runoff from a frequency storm is very big – for this reason a lot of agencies require using frequency storms (or SCS rainfalls) for a safe and conservative design. On the contrary, a NOAA Atlas 14 temporal distribution is based on statistical analysis of historical storms and to certain extent it is a better representative of a real rainfall event. A HEC-HMS model was established to compare the runoffs between using frequency storms and the Atlas 14 temporal rainfall distribution. As shown in Figure 6, the frequency storm resulted in the greatest peak flows while the 24-hr all case 50% temporal distribution had the lowest peak flow. The other four Atlas 14 temporal distributions (1st quartile to 4th quartile 50%) ended up with peak flows that are very close.
3 COMMENTS