NRCS Rainfall Distributions Based on NOAA Atlas 14 Precipitation Depth and Duration
NOAA Atlas 14 provides the latest official U.S. precipitation frequency, depth and duration data. Visit this post to learn more about how to retrieve and utilize NOAA Atlas 14 data. Not only does NOAA website PF Data Server (PFDS) supply Atlas 14 precipitation depth and intensity data, but also provides temporal distributions. However, these NOAA Atlas 14 temporal distributions shall NOT be confused with the NRCS rainfall distributions which are based on NOAA Atlas 14 precipitation depth data:
- NOAA Atlas 14 temporal distribution: not a “nested” storm, created by historical storm event statistical analysis for each climate region, and then grouped by different durations (6-hr, 12-hr, 24-hr and 96-hr ), quartiles (1st, 2nd, 3rd, 4th, and all cases), and percent of occurrence (10%, 20%, … 90%) – again, refer to this post for detailed introductions.
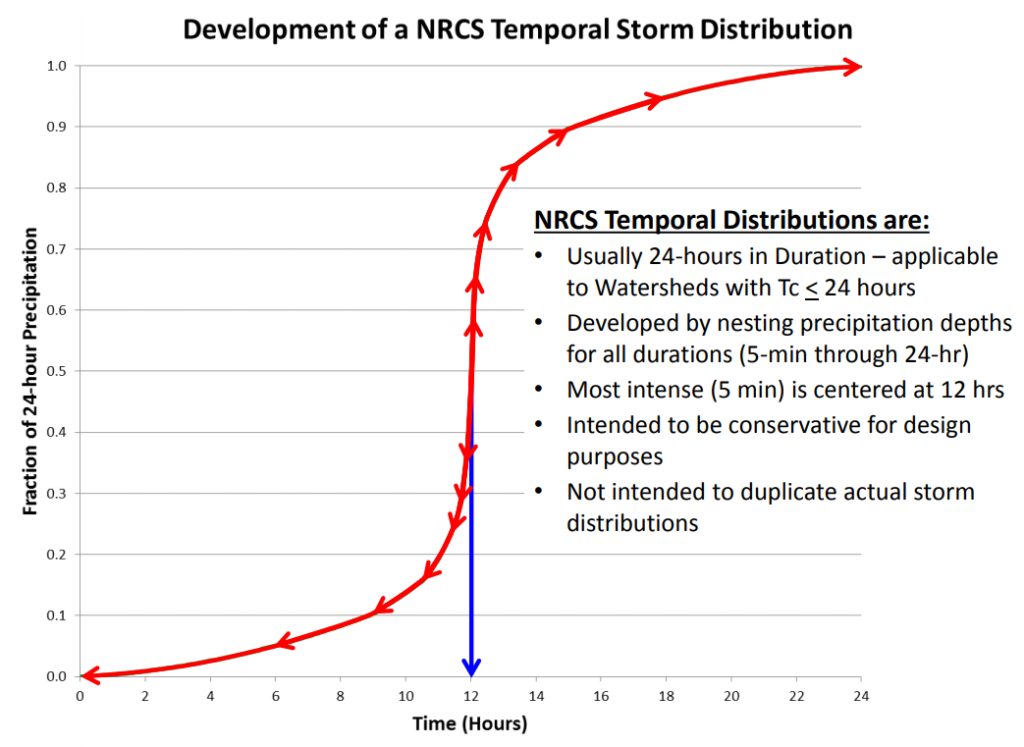
- NRCS rainfall distributions based on NOAA Atlas 14 precipitation depth data: a “nested” synthetic storm distribution, usually the storm duration is 24 hours, created by embedding shorter duration precipitation depths into 24-hr distribution. These new NRCS distributions are to replace the obsolete NRCS/SCS Type I, IA, II, and III distributions.
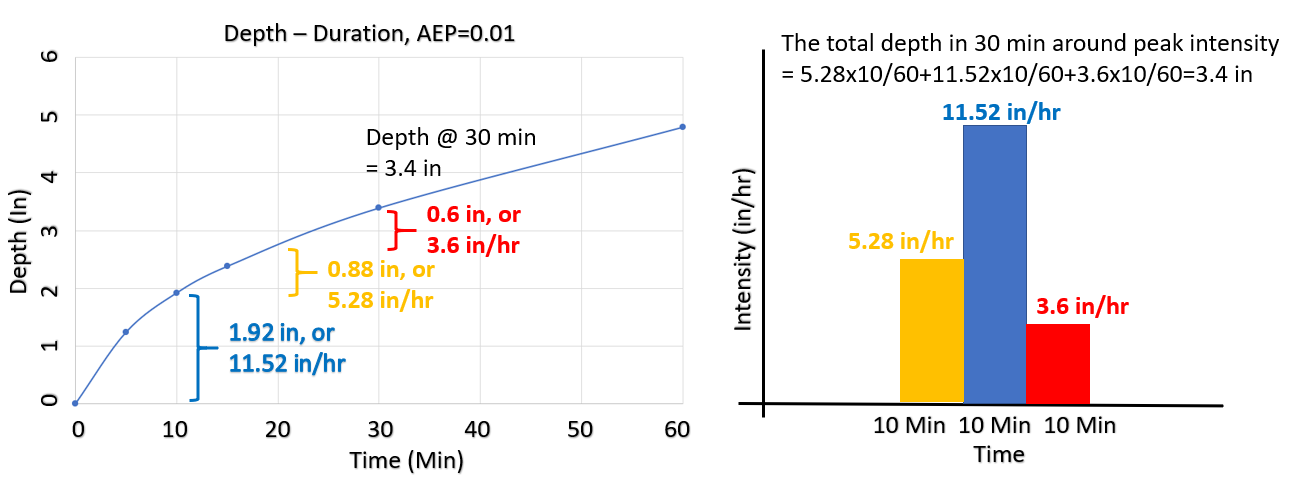
Alternating Block Method (Figure 1) is usually utilized to generate a “nested” storm distribution as explained in this post. Per NRCS NEH Part 630 Chapter 4, one of the principles of hydrology assumes the peak discharge of a watershed is determined primarily by rain falling in a duration equal to the watershed time of concentration. A “nested” storm distribution is constructed in a way that any shorter duration depths are “embedded” within the design storm duration with the maximum depth increment being placed at the intended peak intensity position (Figure 2). For this reason, a hydrologic model using a “nested” storm distribution is able to examine the watershed performances under shorter storm durations (up to the storm distribution duration) in a single run.
Two types of NRCS distributions can be developed using the method described above:
- Site specific distributions using the site’s Atlas 14 precipitation depth data. Different storm frequencies may have different distribution patterns, if desired (mainly because ratios of shorter duration precipitation depths to 24-hr depths vary greatly for different storm frequencies).
- Regional distributions by analyzing and generalizing Atlas 14 precipitation data set over a large region (counties, states, or even multiple states). The regional distributions can be applied to the entire region targeted.
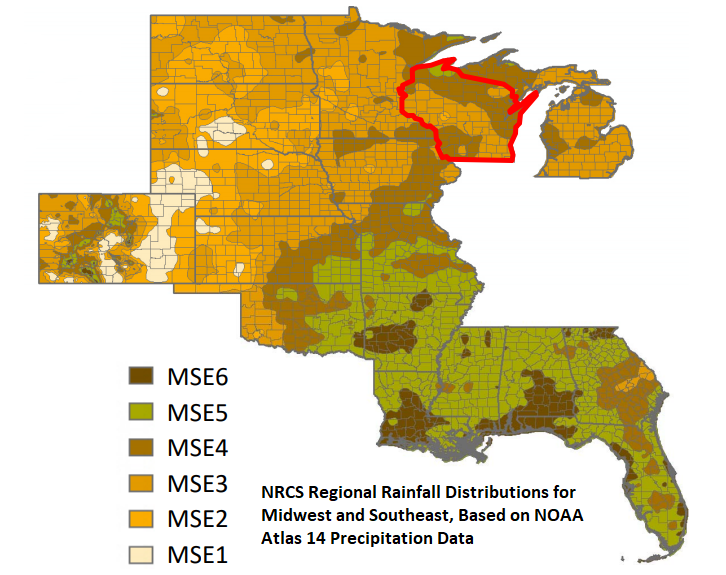
NEH Part 630 Chapter 4 has very detailed instructions on how to develop rainfall distributions based on Atlas 14 precipitation depth and duration data. In recent years, NRCS has developed several regional Atlas 14 rainfall distribution (NRCS Website, NRCS Atlas 14 Rainfall Distribution Presentation), including Midwest and Southeast states (Region MSE1 to MSE6 in Figure 3) and Ohio Valley and Neighboring States (Region A, B, C, and D in Figure 4).

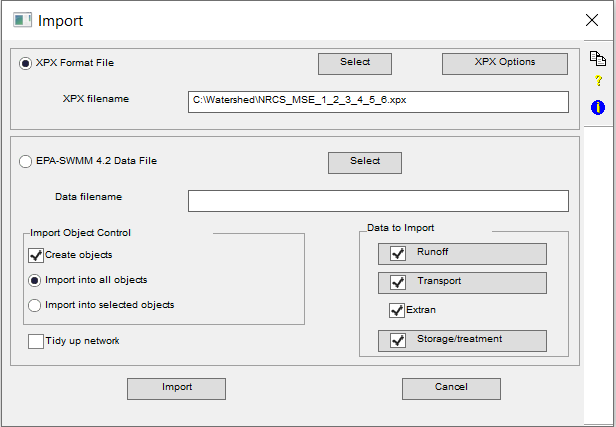
XPSWMM has prepared MSE1 to MSE6 and Ohio Valley Region A, B, C, D 24-hr rainfall distribution template xpx files which can be easily imported to XPSWMM’s Global Data –>(R)Rainfall. The steps of importing a template xpx rainfall file into XPSWMM is easy: go to File –> Import/Export Data –> Import XPX/EPA Data … and select the desired xpx file to import (Figure 5). After importing the files, go to Configuration –> Global Data –>(R)Rainfall to check the imported rainfall files. A good practice is to make a copy of the imported files to work with by not damaging the original imported rainfall files. Ensure the options are set as Cumulative Depth and time interval of 0.1 hour (Figure 6).

In Figure 6 the multiplier can be entered as the 24-hr precipitation depth, or it can be left as 1.0 but later be defined in the global storms setting by overriding multiplier (Figure 7).

The XPSWMM NRCS rainfall distributions in the xpx files have been compared with those from HydroCAD and they match to each other exactly. The csv files of NRCS rainfall distributions from HydroCAD are re-formatted for better understanding which can be downloaded here.
HEC-HMS frequency storm method uses a similar procedure to generate a “nested” storm of various durations. After converting the HEC-HMS results (using frequency storm method) incremental precipitation depth time series to cumulative precipitation depth time series, it is easy to verify the maximum precipitation depths of shorter duration storms are actually the same values as those entered in the frequency storm method editor.
1 COMMENT