Use HEC-GridUtil to View and Process Gridded Data Stored in DSS files (1 of 2)
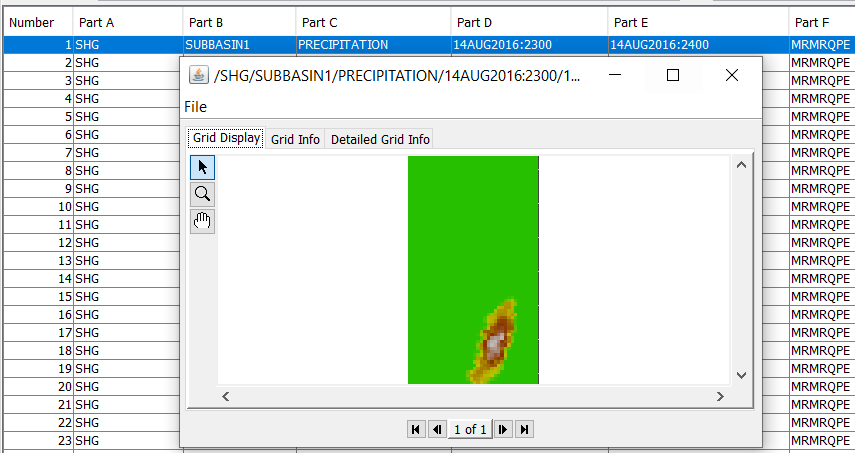
Gridded data, either a static single grid or time series grids/grid set, can be imported and stored in HEC-DSS files using Vortex or HMS Gridded data importer. HEC-DSSVue is a tool to view and manage gridded data in DSS files (Figure 1) and its introduction can be found here.
HEC-GridUtil is another tool developed by USACE Hydrologic Engineering Center to manage and view gridded data stored in DSS files. HEC-GridUtil has some capabilities that HEC-DSSVue does not possess, such as advanced gridded data view function, display gridded data and shapefiles (layers) within a single window, gridded data analysis, mosaic or extract gridded data. HEC-GridUtil is mainly used to analyze gridded time series precipitation data, although it can handle any single or time series gridded data type stored in DSS.
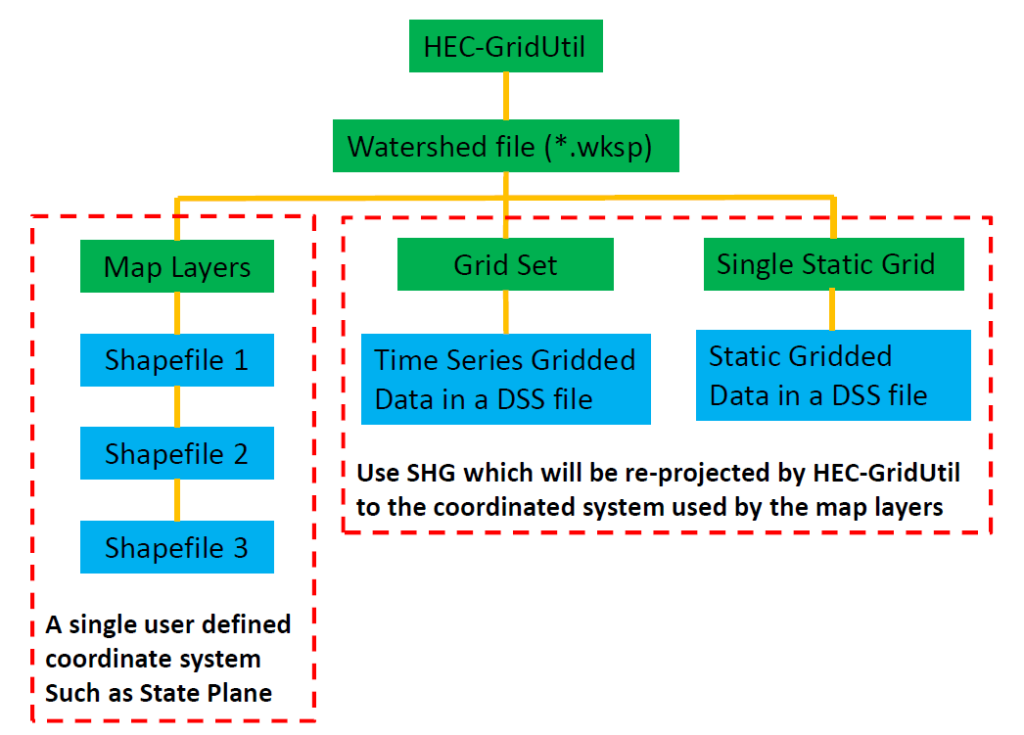
As illustrated in Figure 2, a watershed file (*.wksp), or a project file, is the container of map layers and gridded data. Although HEC-GridUtil is mainly designed to view and manage gridded data stored in DSS files, various shapefiles such as watershed boundaries, streams, or waterbodies, can be imported to HEC-GridUtil as map layers to help visualize gridded data. As of 2022, it appears that HEC-GridUtil 2.0 only supports DSS files of Version 6.
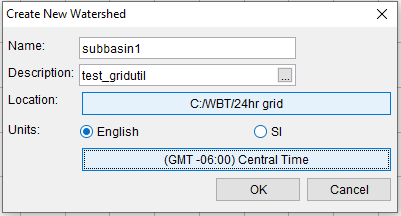
To start a new HEC-GridUtil project, create a new watershed file first (Figure 3A) by clicking File —> New Watershed… from the top menu. The unit and time zone settings should follow the same unit and time zone of the gridded data to be imported.
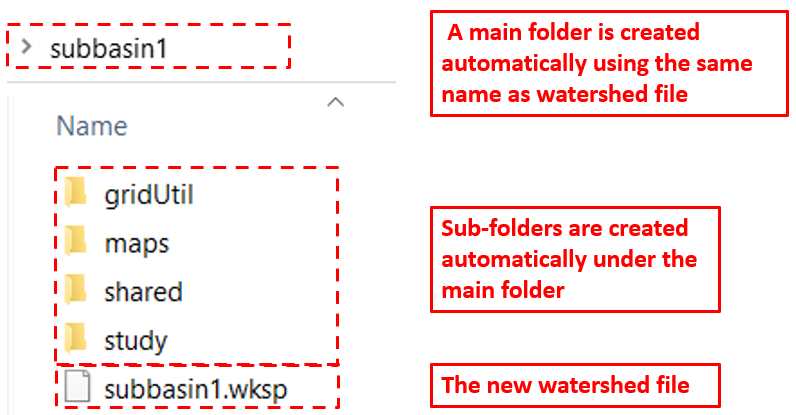
When a new watershed file is created, a main folder of the same name and four sub-folders are created automatically as shown in Figure 3B. The new watershed file (*.wksp) is placed under the main folder by HEC-GridUtil.
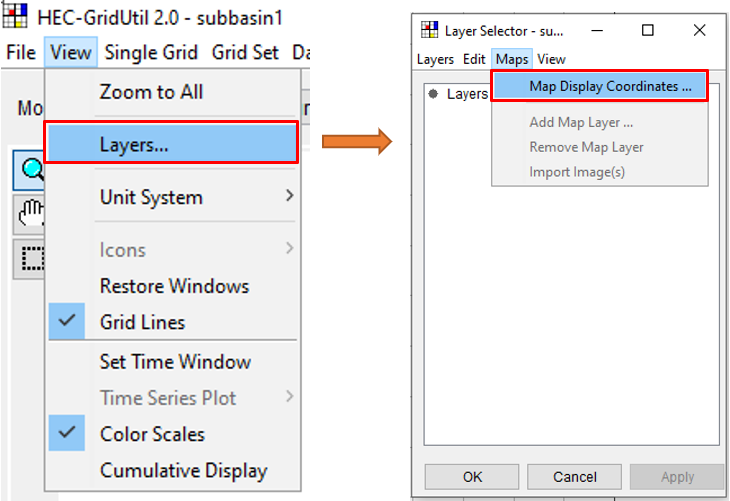
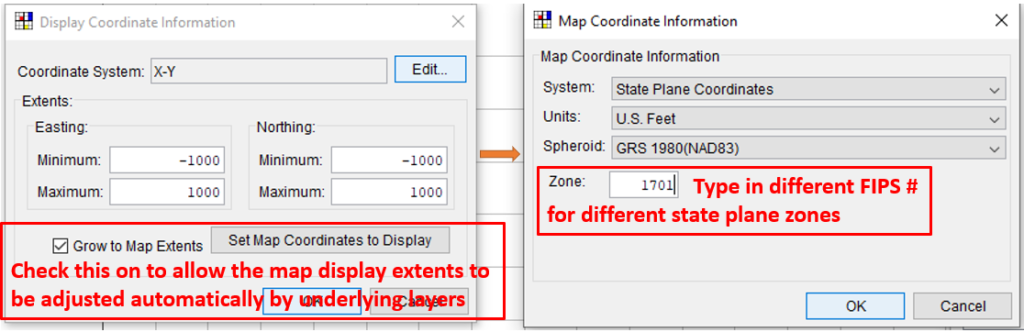
Once a new and blank watershed file is created, go to View —> Layers… to open the Layer Selector window (Figure 4). In the Layer Selector, click Maps —> Map Display Coordinates… to select a user defined coordinate system (Figure 5). The user defined coordinate system should be set up as the same system of the shapefiles since HEC-GridUtil does not have the capability of coordinate system re-projection except for gridded data in SHG or HRAP (Hydrologic Rainfall Analysis Project grid coordinate system).
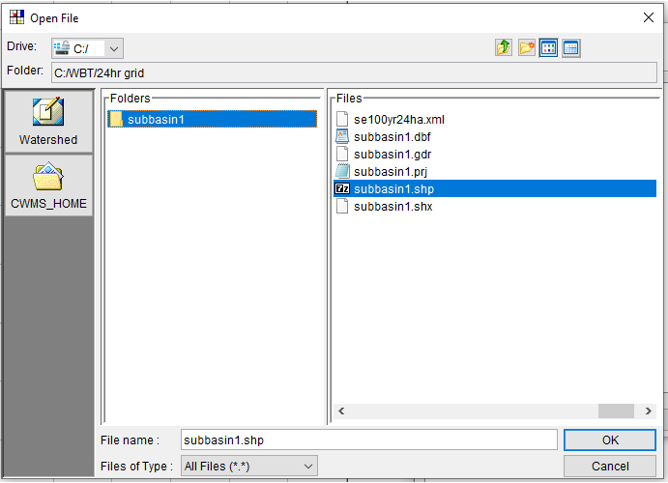
Click and enable “Allow Layer Editing” first to Add Map Layer... (Figure 6 and Figure 7).
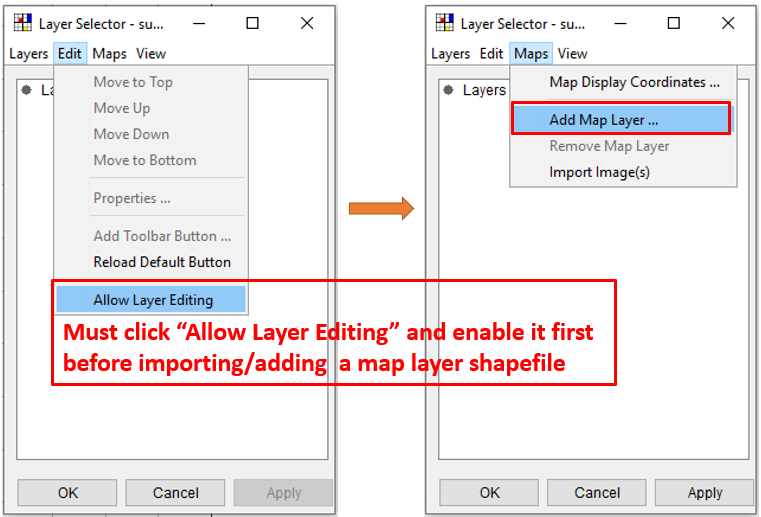
Figure 6
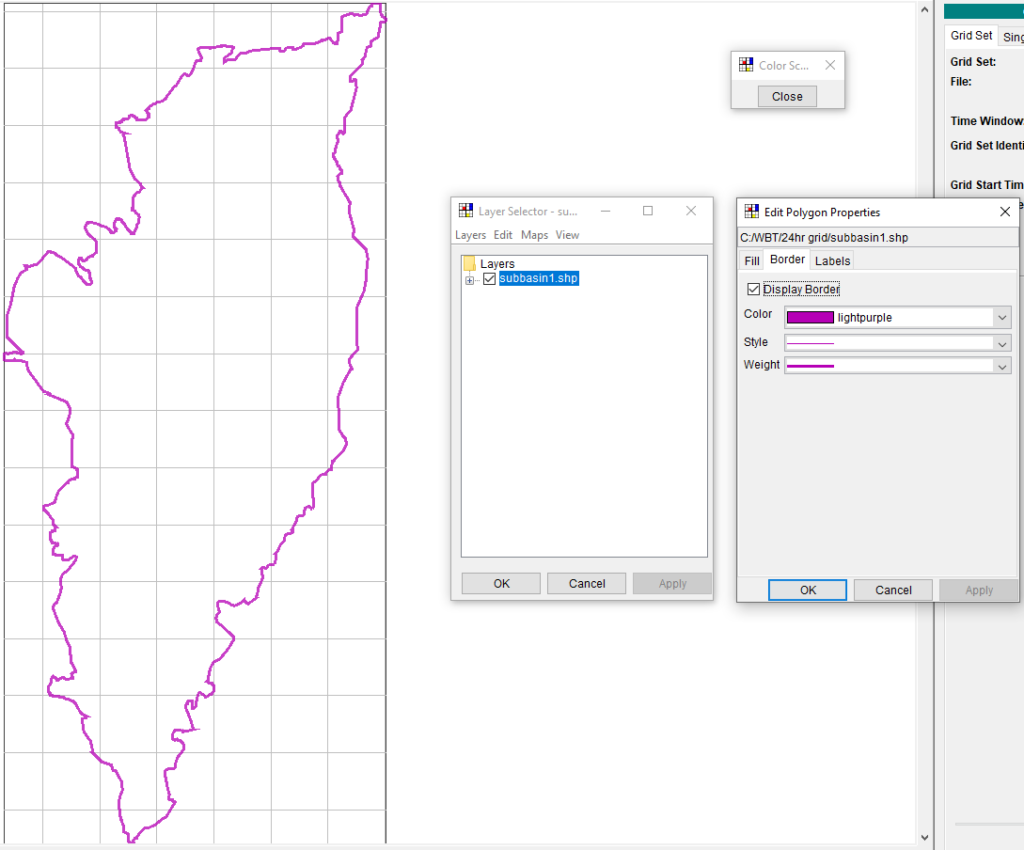
The added layer (shapefile) display properties can be edited by right click the layer in Layer Selector window and select “Properties” (Figure 8).
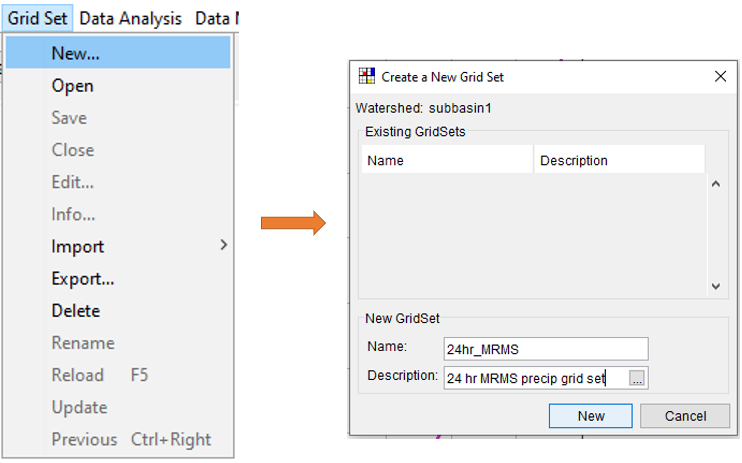
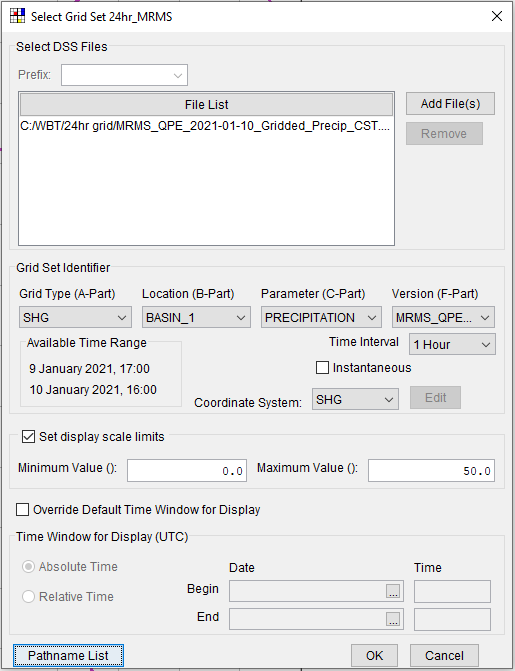
To import time series gridded data stored in DSS files, first click Grid Set —> New… from the top menu to give the new grid set a name (Figure 9) and then click “New” button to go to Figure 10. In Figure 10, click Add Files(s) to add a DSS file of version 6 which stores the time series gridded data of your interest. The pathname A, B, C, and F must be chosen appropriately as well as the coordinate system (SHG by default for most of the gridded data stored in DSS files)
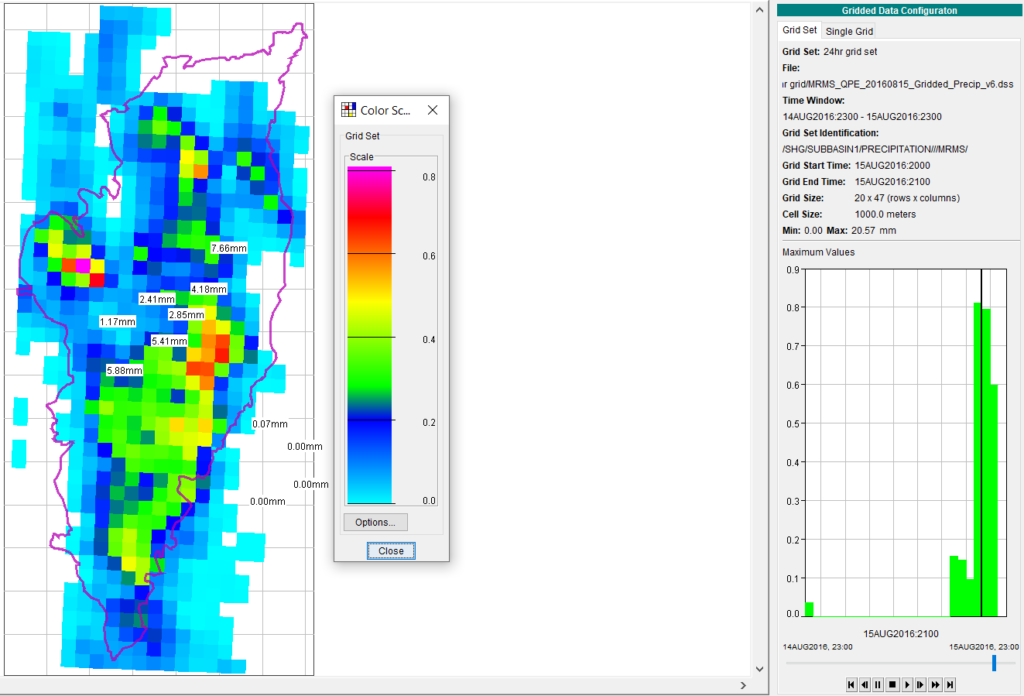
The newly added grid set should be displayed in the main window (Figure 11). If for some reasons it does not show up, go to Layer Selector, right click Gridded Data and change its properties (Figure 12).
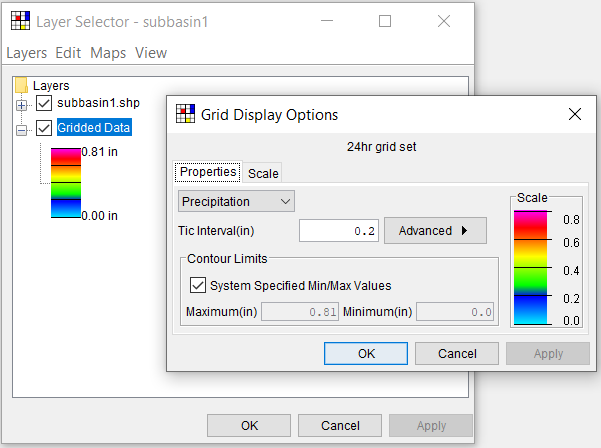
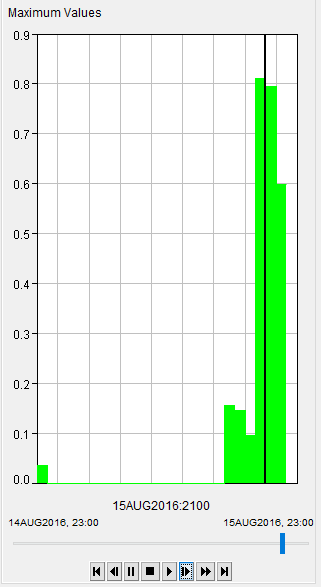
Another possible reason that the gridded data does not show up in the main window is because of the current display time at which the gridded data happens to have a zero or NoData value. To show the time series gridded data at another time, use the animation control buttons on the right side of the main window including play, step forward, step back, and the time slider (Figure 13).
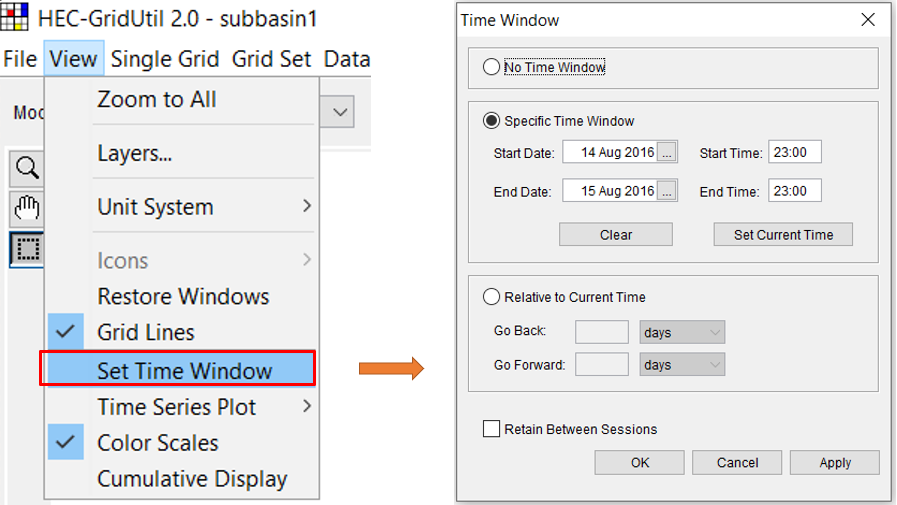
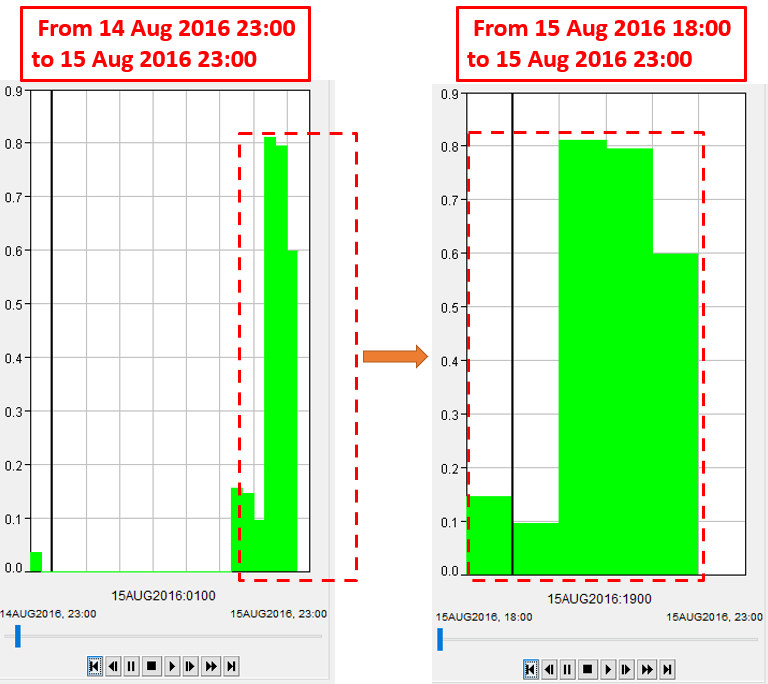
Time window, a concept originally developed in HEC-DSSVue, is also available in HEC-GridUtil. Click View —> Set Time Window to open the time window setting (Figure 14). Normally the time window should coincide with the time span of the time series gridded data so that no gridded data in the time series is hidden from being displayed in HEC-GridUtil. However, sometimes it is convenient to set the time window to a time period of your interest when dealing with time series gridded data covering a much longer time span. In Figure 15, the right picture only shows the gridded data statistics (by default maximum grid value at each time interval) of the last few hours in the left since the right picture is under a smaller time window span.
Loading a single static grid to HEC-GridUtil is similar to the procedures introduced above for time series gridded data importing by clicking Single Grid —> New… from the top menu and the steps will not be repeated.
A second post about HEC-GridUtil can be found here, which focuses on its time series gridded data analysis function and grid set extraction.
Leave a Reply