Use HEC-GridUtil to View and Process Gridded Data Stored in DSS files (2 of 2)
HEC-GridUtil is tool developed by USACE Hydrologic Engineering Center to manage and view gridded data stored in DSS files. The Post 1 of 2 here demonstrates on how to start a new HEC-GridUtil project, how to import and view gridded data, and how to add map layers. This post is to focus on HEC-GridUtil other functions including analysis on time series gridded data (or grid set), as well as grid set mosaic and extraction.
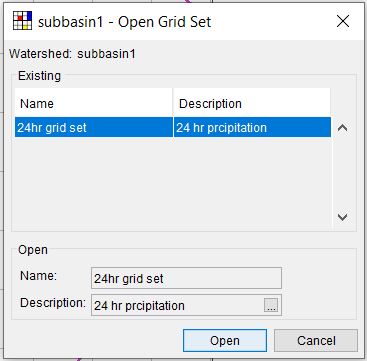
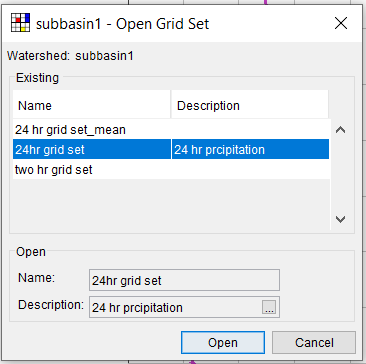
A HEC-GridUtil project has been created in Post 1 of 2. Open the project (Open Watershed…) and load the grid set that was created early by clicking Grid Set —>Open (Figure 1).
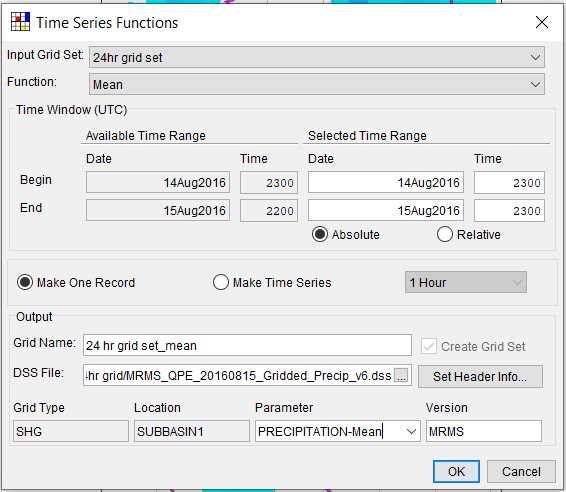
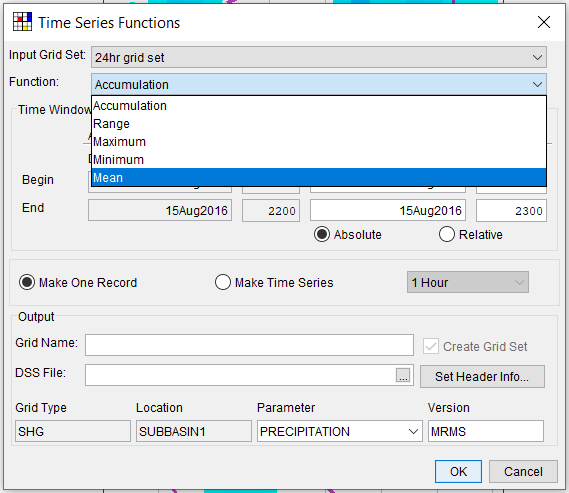
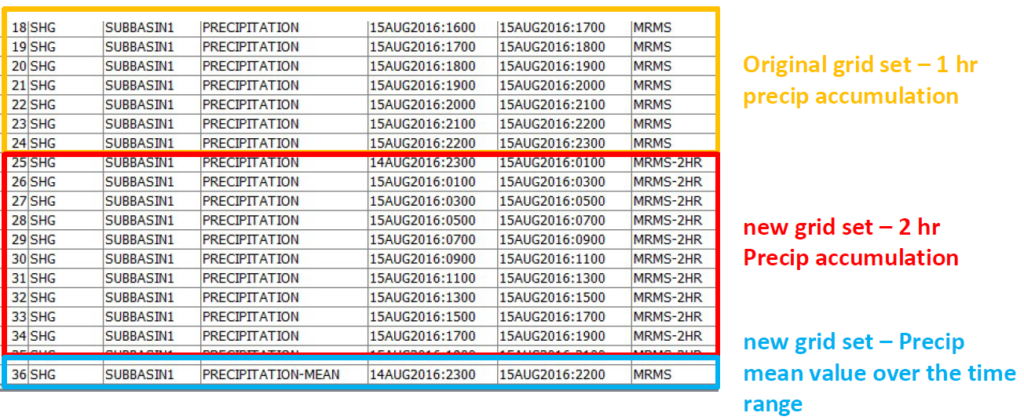
An one-record grid (still a time series grid set, but only with one record!!!) can be created by setting its cell values to be the mean values of the cells over the selected time range (Figure 2). Likewise, the minimum, maximum, range, and accumulation one-record grid can be created if needed (Figure 3).
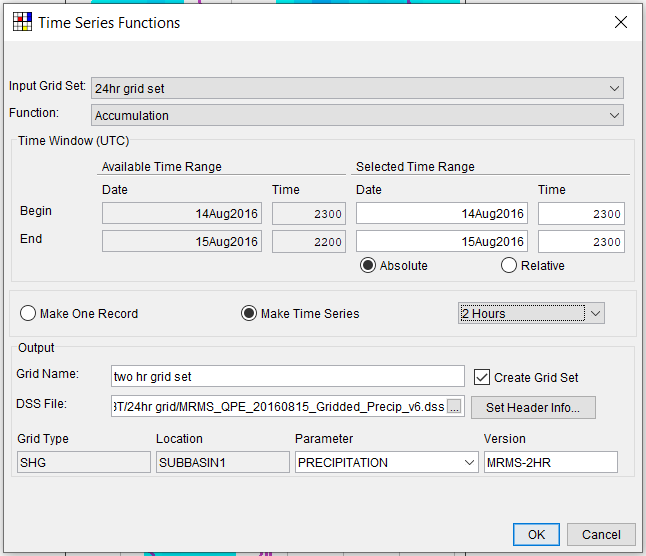
To make a “real” time series grid set with multiple record, check on “Make Time Series” and select a new time interval (1 hr, 2hr, …, day, month, year) as desired (Figure 4). In Figure 4, choose “Accumulation” as the Function, and the time interval is set to 2 Hours, which would convert hourly precipitation gridded data to 2-hour precipitation gridded data (each cell value is an accumulated precipitation depth at 2-hour interval, instead of 1 hour).
The two new grid sets created above are added to the current GridUtil project automatically (Figure 5). They also can be viewed in HEC-DSSVue (Figure 6) by opening the DSS file.
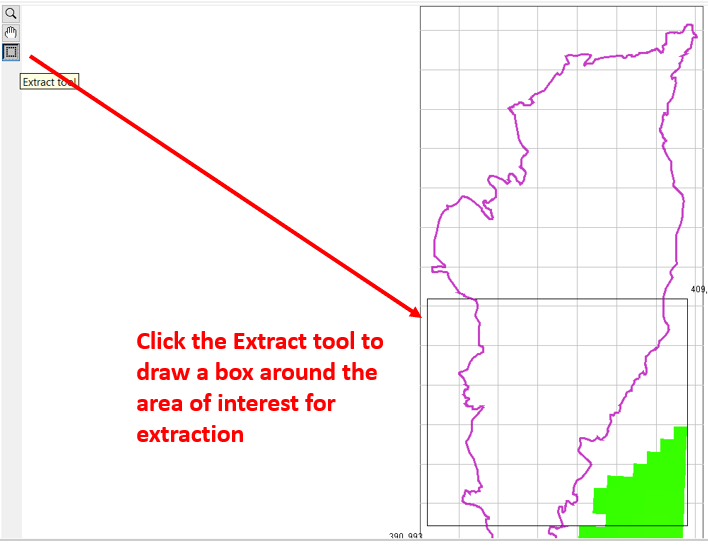
A large grid set can be clipped or extracted to a smaller area to save computer resources and shorten model running time. Use the extract tool on the left of the main window of GridUtil to draw a box around the area of interest (Figure 7).
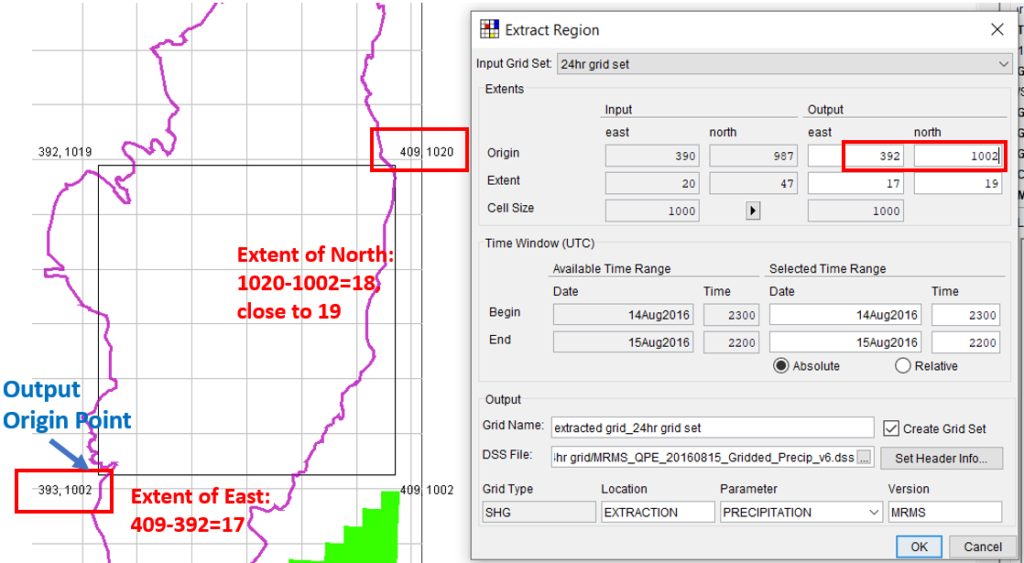
Click Data Management —> Extract Region to open Extract Region window (Figure 8). In Figure 8, make sure the auto-filled output east and north values for Origin and Extent are correct by comparing the values with those shown on the main window.
HEC-GridUtil supports other functions such as grid set mosaic which can be found from the User’s Manual Chapter 8 and 9.
Leave a Reply