2019 Regional PMP Study for LA, MS, OK and AR and Its Application in HEC-HMS
Historically Probable maximum precipitation (PMP) rainfall depths for spillway design were estimated using NOAA procedure and methodology such as HMR 51 and HMR 52. However, since HMR 51 and HMR 52 studies were done more than forty years ago and they are often considered obsolete by some dam safety officials and government agencies. A new regional PMP study sponsored by Louisiana, Mississippi, Oklahoma, and Arkansas was completed in 2019 by leveraging new precipitation data and meteorology technique.
A GIS-based tool to estimate PMP depths (based on basin drainage areas and durations) and temporal distributions was developed by the 2019 PMP study. After downloading the tool from this link, unzip the file and copy the entire folder of PMP_Evaluation_Tool including its two sub-folders to a local drive (Figure 1).

Go to ArcMap, open Catalog, navigate to the PMP Evaluation Tool folder and click “Gridded PMP Tool” to open the tool (Figure 2). As shown in Figure 2 and Figure 3, furnish your basin boundary shapefile, and check on all storm durations for Local Storm (Figure 2), General Storm and Tropical Storm (Figure 3). Local Storm should not be used for a basin with drainage area greater than 100 square miles.


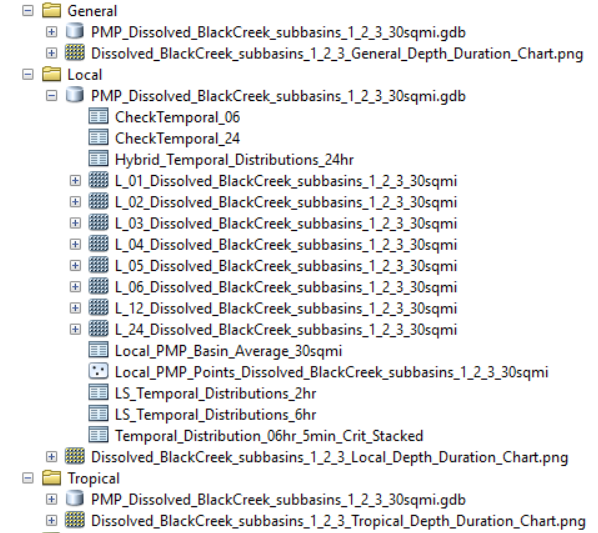
The output of PMP Evaluation Tool is shown in Figure 4. In addition to gridded PMP depths and basin average PMP depth-duration data sets, 21 temporal distributions are generated by the PMP tool as summarized in Table 1.


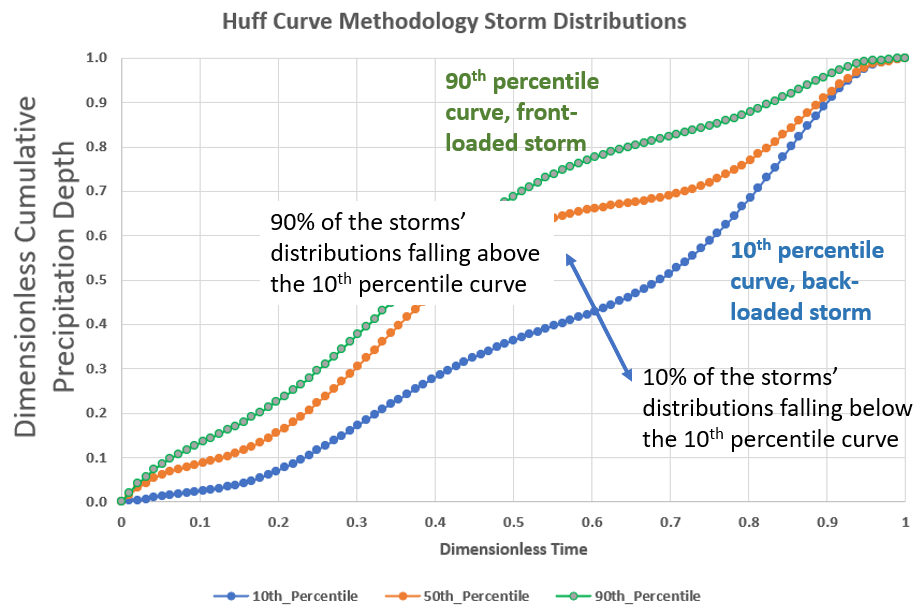
The 10th, 50th and 90th percentile distributions are based on historical storm statistic analysis using Huff Curve Methodology. As indicated in Figure 5, the Huff Curve PMP percentile distribution method is similar to that of NOAA Atlas 14 temporal distributions, however, the percentile curve naming conventions are different (a 10th percentile curve here will be called as 90% curve in NOAA Atlas 14 distributions).

Like other alternating block storms such as SCS Type I, IA, II &III and HEC-HMS Frequency Storm, the critically stacked temporal distribution is not a duplicate of any actual storm distributions and its application usually ends up with a more conservative design due to its “nested” characteristics. Refer to this post for details about Alternating Block Method.
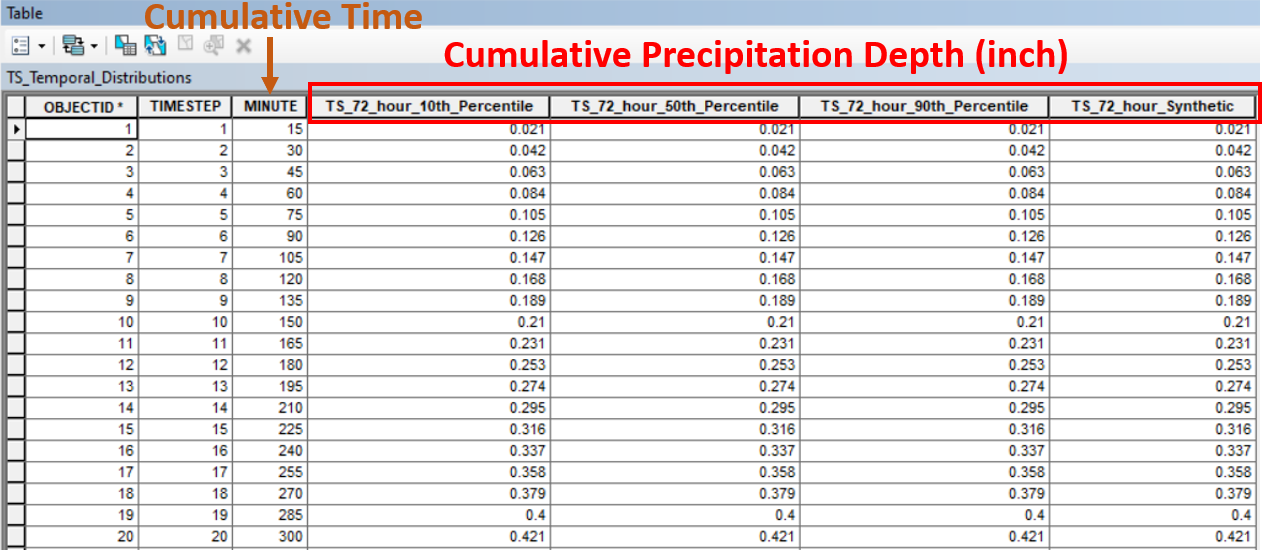
The temporal distribution output is presented in the format of cumulative time Vs. cumulative precipitation depth (inch) as shown in Figure 6.

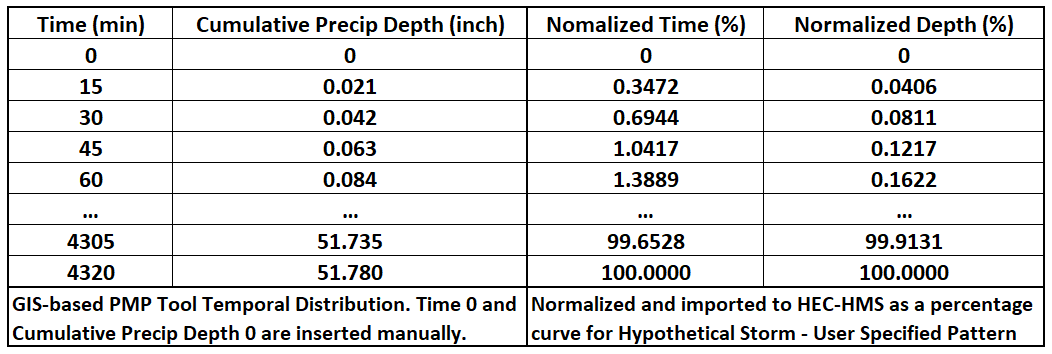
To apply the above PMP temporal distributions in HMS as hypothetical storm – user specified pattern, the cumulative time and cumulative precipitation depth data set needs to be normalized or standardized first in term of % using Excel spreadsheet (Table 2).

Copy the normalized time (%) and depth (%) in Excel to HEC-HMS to create a new Percentage Curve type of paired data (starting with 0, 0 and ending with 100, 100) and use the curve and other PMP Tool results to define a new Hypothetical Storm – User Specified Pattern (Figure 7). There are multiple PMP temporal distributions & durations as a result of running the PMP Tool. For safe design purpose, different PMP temporal distributions should be considered during hydrologic and hydraulic analysis and choose the PMP distribution and duration that generates the largest peak flow or highest pool elevation for final dam and spillway design.

Leave a Reply