Modeling Reservoir and Dam in 2D HEC-RAS by Storage Area and SA/2D Connection
Instead of being modeled in 1D HEC-RAS by storage area and inline structure, reservoir and dam can also be modeled in 2D HEC-RAS by storage area + SA/2D connection + downstream area in 2D domain (Figure 1). The advantages of using 2D HEC-RAS instead of 1D to model a downstream area include avoidance of 1D river cross section cut line placement which is usually time consuming and arbitrary, the capability to model flow in 2D instead of 1D, and easier SA/2D connection setup. Make no mistake, to build a detailed and valid 2D HEC-RAS model, a modeler still needs to make a lot of efforts to set up an accurate terrain model, appropriate breaklines, 2D refinement regions, SA/2D connections like dams/bridges/culverts, Manning’s n layer, mesh sizes, and boundary conditions.
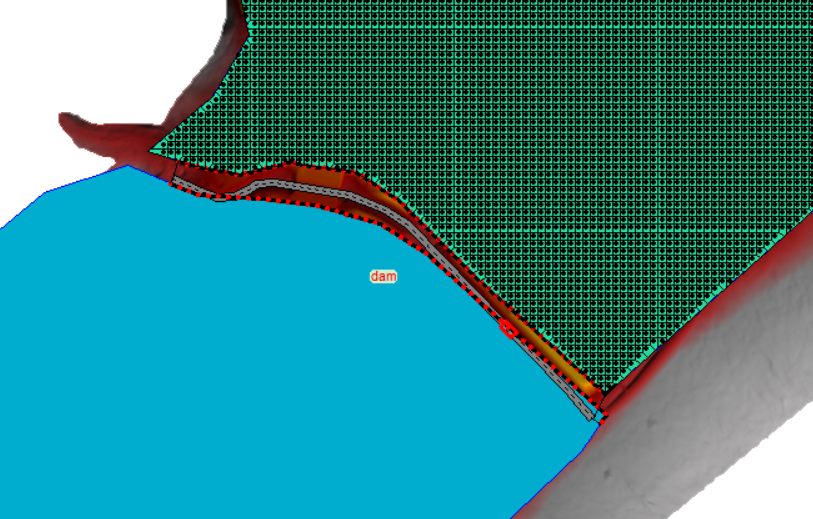
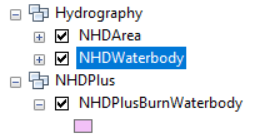
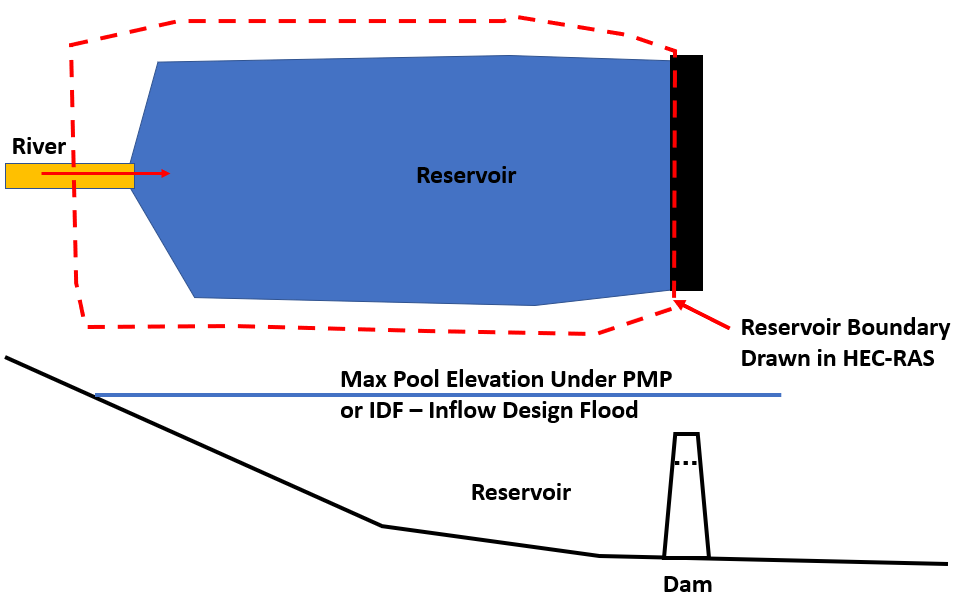
The storage area boundary representing a reservoir can be drawn by referring to NHDPlus HR waterbody polygons (Figure 2) or google satellite images. The downstream side of a reservoir is usually the dam location while the upstream boundary of a reservoir is where the river flowing into it starts to become inundated. A more “correct” way to determine upstream boundary of a reservoir is to observe where the maximum reservoir pool stops at under PMF/PMP or IDF – Inflow Design Flood through different model test runs (Figure 3) and the reservoir (storage area) boundary polygon should be drawn to at least cover this limit.
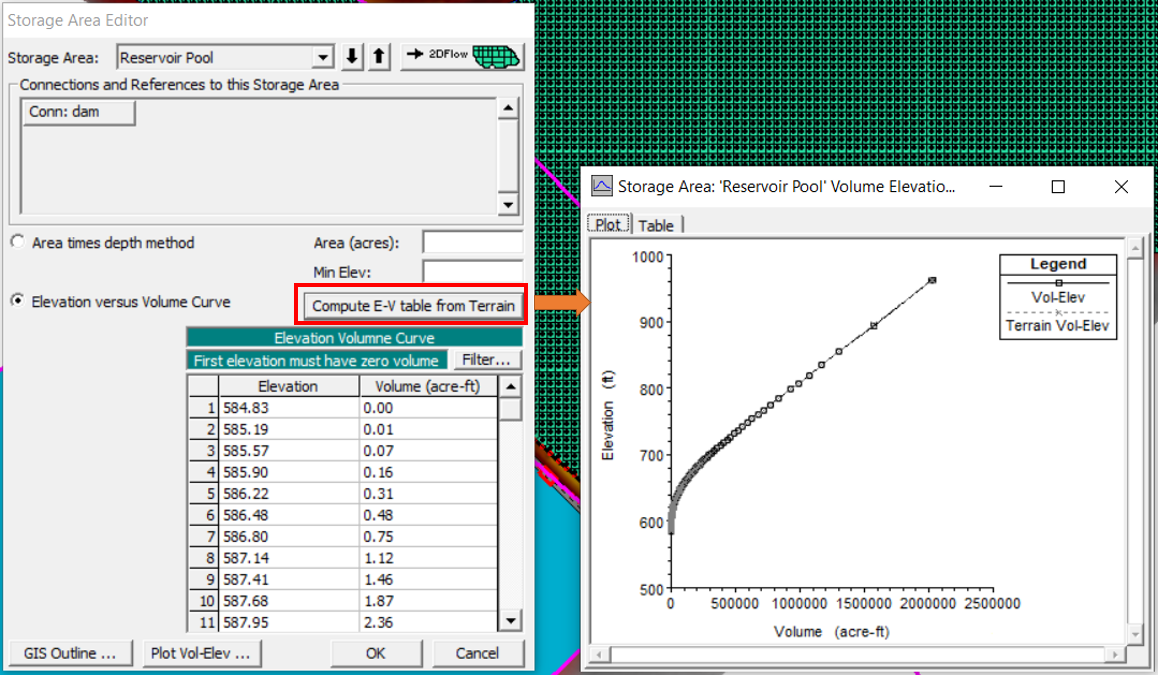
After a reservoir (storage area) boundary is drawn in HEC-RAS, go to its data editor to let HEC-RAS pull Elevation (ft) – Volume (ac-ft) curve data set automatically through clipping the underlying terrain with the boundary polygon (Figure 4). HEC-RAS actually uses this curve data set to do storage area routing calculation and it can be manually revised if deemed necessary.
The downstream area of a dam can be modeled by a 2D domain in HEC-RAS. Ideally the upper limit of the 2D domain is the toe of the dam embankment. (Note: It may not be wise to put the 2D domain upstream boundary at the top of dam or the slope of the dam. HEC-RAS does not like 2D cells on steep surfaces with a grade greater than 10%. If for some reason, you have to model the dam slope within a 2D domain, make sure the cell size is big enough so one cell is covering the entire slope from dam top to toe.)
For the downstream boundary location, there are several options for a modeler to consider:
- Run dam breach analysis using a very large initial 2D domain. Set the final downstream boundary of the 2D domain to a location where the difference between the peak flood stages of the breach and non-breach runs are less than 1 foot.
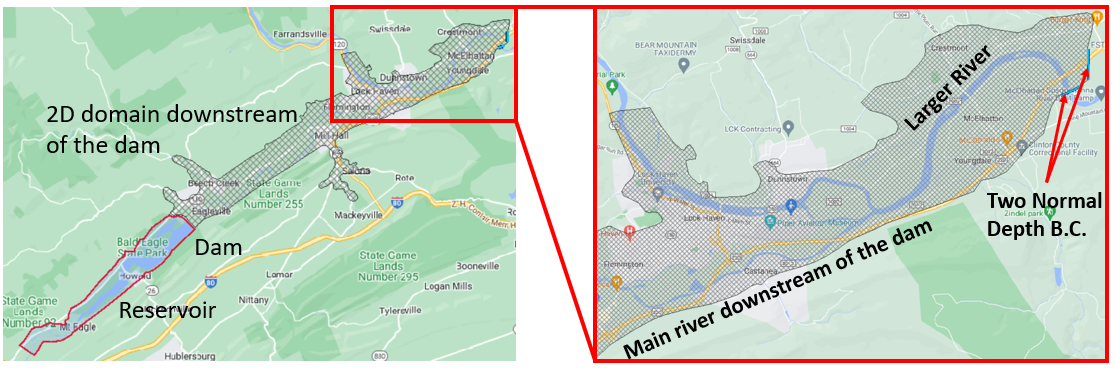
- If the main river downstream of the dam discharges to a waterbody (a lake, ocean, or a larger river), establish the downstream boundary of the 2D domain at the receiving waterbody (Figure 5);
- Set the downstream boundary of the 2D domain at an apparent high ground location such as an elevated roadway or levee;
- Consult with the dam owner and local stakeholders to get their input on where to end the 2D domain downstream of the dam.
In the 2D domain, detailed breaklines or 2D refinement regions should be added on, as well as critical hydraulic structures such as bridges and culverts. The 2D cell sizes can be 1000ft x 1000ft, 500ft x 500ft, 200ft x 200ft, 100ftx100ft, or even 20ft x 20ft depending on the project scope of services, the area of the 2D domain, project budget and schedule.
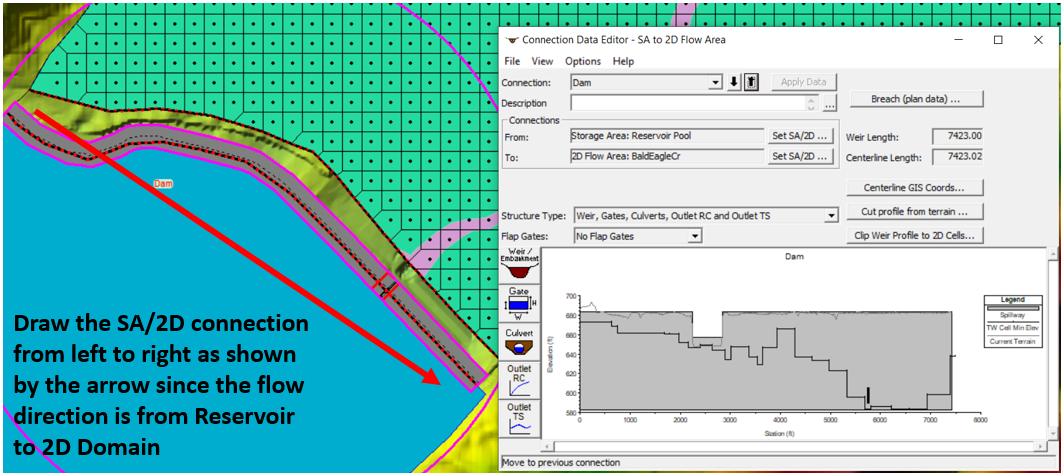
In between the storage area (reservoir) and the 2D domain downstream of the dam, a SA/2D connection can be inserted to represent the dam and spill, and drawdown structure (Figure 6). As explained in Figure 7, the SA/2D connection should be drawn from left to right when facing the flow direction (towards downstream). The SA/2D connection line should generally follow the centerline of the dam top and its exact station-elevation should be defined in weir/embankment data editor window in Figure 8.
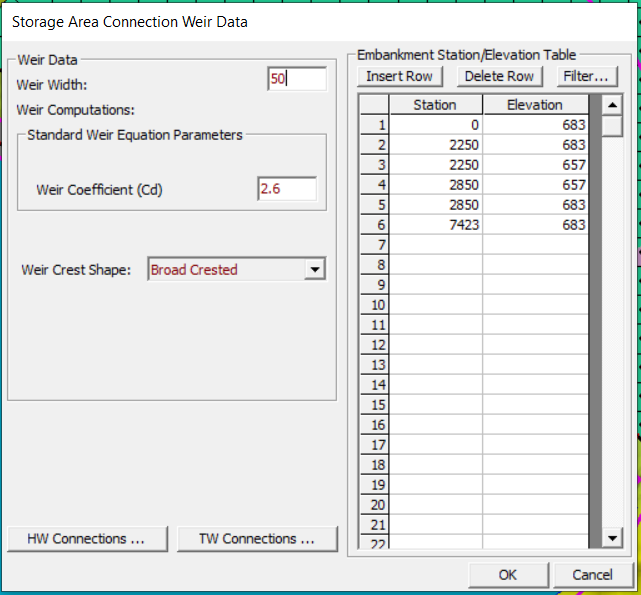
The drawdown structure, depending on their design and how they are operated, can be modeled as gates, culverts, outlet rating curves, or outlet time series (Figure 7).
To model a dam breach or dam break analysis in HEC-RAS, refer to this post.
2 COMMENTS