Rational Method and Modified Rational Method – Peak Flow and Hydrograph
For small drainage areas, the rational method is widely used to calculate peak flows of different drainage design levels to size storm sewer, inlets, culverts, and ditches. The rational method is simple and easy to apply and the only output is peak flows in cfs:

In the equation of Figure 1, a unit conversion coefficient 1.0083 (43560/12/3600) is omitted. Some typical runoff coefficients are listed in Table 1 which is taken from City of Houston Infrastructure Design Manual 2021. Some drainage design manuals require the adjustment of runoff coefficients by a Frequency Factor Cf to account for the reduction of infiltration losses during severe storms (Table 2).


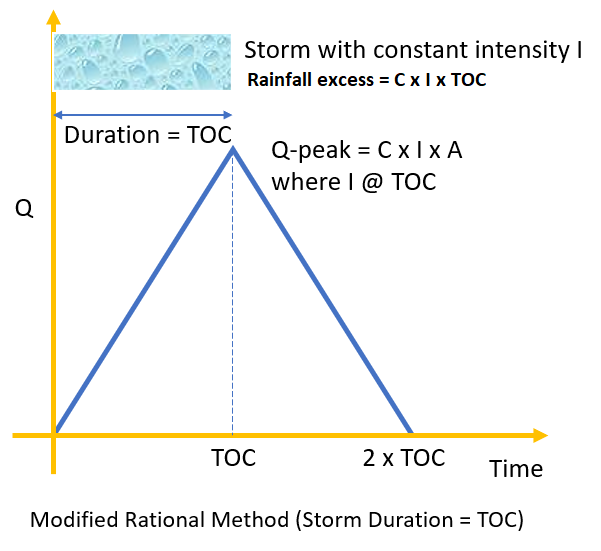
The rational method usually is applicable for a small drainage area not larger than 200 acres (some regulating agencies allow this upper limit up to 640 acres, such as Kansas DOT). A large watershed needs to be subdivided into small ones to apply the rational method. To calculate a maximum peak flow for safety design, the rainfall intensity I is taken as the storm duration equal to TOC, since rainfall intensity I decreases as the storm duration increases, so does the peak flow.
The rational method was originally meant to size small drainage structures and diches by using the calculated peak flows. To make it suitable for sizing detention or retention facilities, scientists and engineers introduced additional parameters to generate a hydrograph based on the original rational method – Modified Rational Method (Figure 2A).
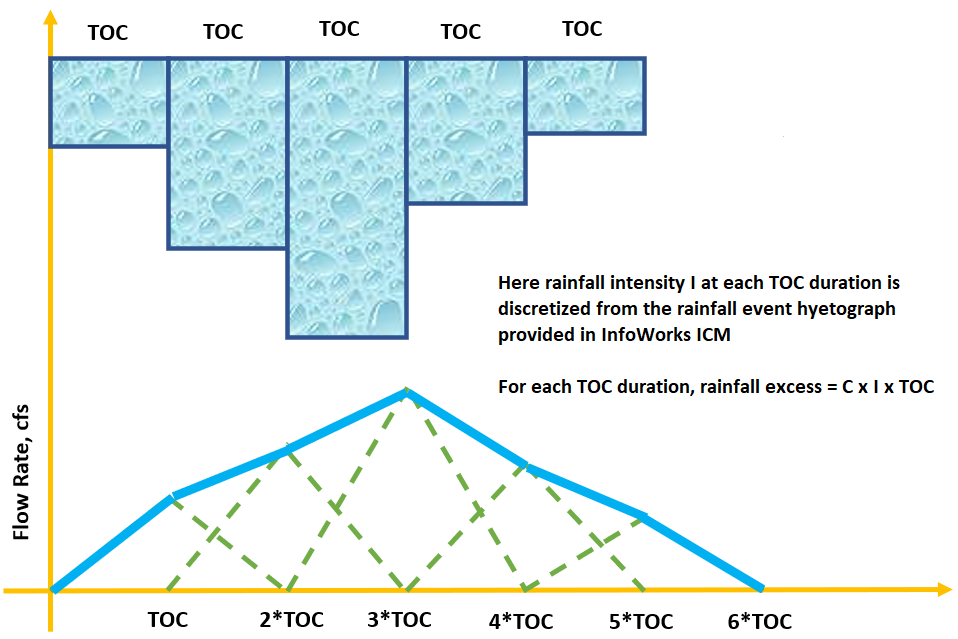
In InfoWorks ICM, the rational routing model is one of the built-in rainfall-runoff transform/routing methods, which first converts a continuous rainfall hyetograph into discrete ones with the same rainfall duration of TOC. For each discretized rainfall, the sub-hydrograph will be generated according to the Modified Rational Method hydrograph concept and the final total hydrograph is the sum of all the sub-hydrographs (Figure 2B).
FHWA HDS 2 proposes a simple way to calculate the required storage volume using triangular shape hydrograph of modified rational method as shown in Figure 3A, in which the recession limb is taken as 1xTOC.

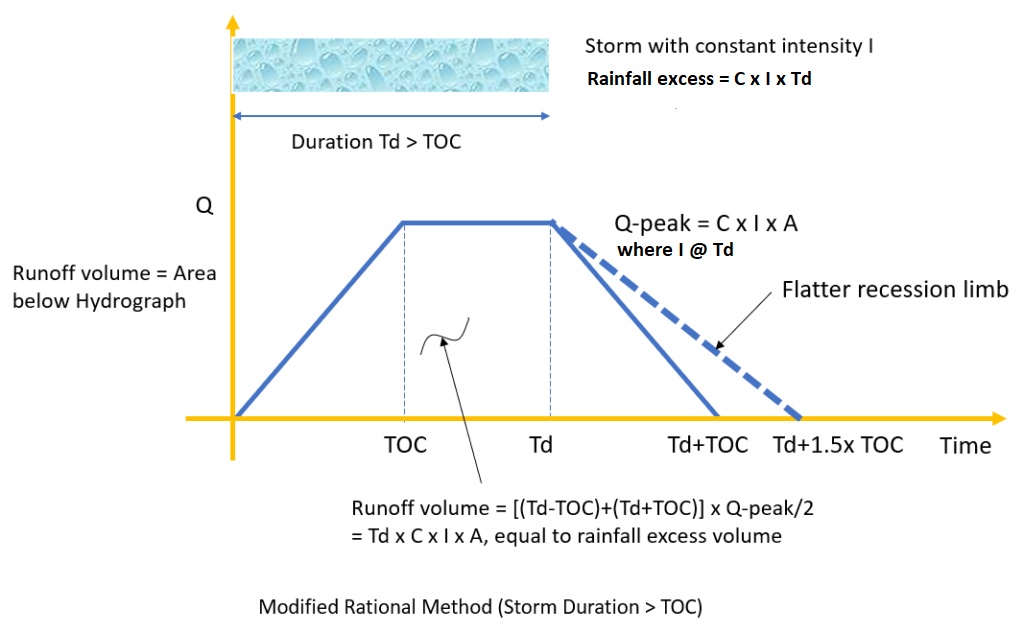
For the application of sizing a detention basin, runoff volume plays a more important role than peak flow and a storm duration longer than TOC may end up with a larger required detention volume (a safer design), even though this longer duration storm produces smaller peak flows. For this reason, the FHWA HDS2 method in Figure 3A can be further revised to show the scenario of storm duration longer than TOC (Figure 3B). Note that in Figure 3B, the rainfall intensity I calculation is based on the rainfall duration Td, not the drainage area TOC. The TOC value here will only impact the shape of hydrograph in terms of rising and recession limbs. HydroCAD rational method strictly implements the methodology demonstrated in Figure 3B.

To estimate the required detention basin volume, different storm duration modified rational method hydrographs are generated and the duration which produces the maximum required detention volume is the critical duration and should be chosen for final detention basin design (Figure 4A).
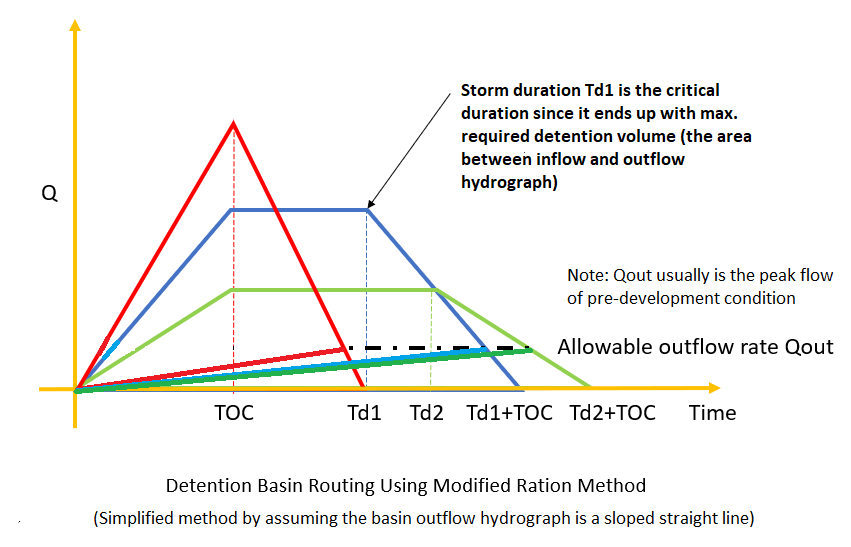
In Figure 4A, a sloped straight line is assumed to be the outflow hydrograph for maximum detention volume estimation purpose. It should be noted usually this is a conservative method, since in reality the outflow hydrograph routed thru a detention basin is curvy which means less required detention volume (Figure 4B).

Virginia DOT Drainage Manual Chapter 6 Hydrology recommends to route hydrographs from storm durations of 1.0 x TOC, 1.5 x TOC, 2 x TOC, and 3 x TOC. Longer storm duration hydrographs (4 x TOC, …, 10 x TOC) may be needed if the above routings and calculations do not end up with a maximum required detention volume (for example, the calculated detention volumes keep increasing). Virginia DOT Drainage Manual suggests that hydrographs with durations less than TOC are not valid and should not be calculated.
Some drainage design documentations suggest using a flatter or steeper recession limb than the ones shown in Figure 2A or 3B (recession limb duration is 1.0 x TOC on these two hydrographs), say, making the recession limb duration as 1.5 x TOC or 2.0 x TOC. An apparent issue with this kind of setting is that a flatter recession limb will violate the mass conservative principle of rainfall excess volume being equal to runoff volume. There is no such a problem when setting the recession limb duration as 1.0 x TOC as demonstrated by Figure 5. So unless the regulating agencies specifically ask for a flatter or steeper recession limb for modified ration method, the recession limb is better off staying at 1.0 x TOC duration, which is simple and conserves the mass between rainfall excess and runoff.
The triangular or trapezoidal shape hydrograph generated by the modified rational method should NOT be used together with other hydrographs if they are not created under the same rainfall distributions as the modified rational method rainfall (refer to Figure 2A or 3B for the constant intensity rainfall distribution with duration of Td).

In a roadway corridor improvement project, sometimes it is required to analyze the impact of post-project peak flow in a bridge crossing due to increased impervious areas from roadway widening (Figure 6). The bridge upstream drainage area is usually much larger than 200 acres and its hydrology better be modeled by a unit hydrograph transform method in HEC-HMS such as SCS UH or Clark UH while using SCS/NRCS or frequency rainfall distributions. In this scenario, it is WRONG to try to combine a modified rational method hydrograph of the roadway corridor drainage area with the bridge upstream drainage area hydrograph (Figure 7).

To evaluate the combined peak flow at the bridge crossing location, each inflow component must be modeled under the same rainfall event. To resolve the issue, the roadway corridor hydrology may also need to be modeled using the same meteorology model rainfall event as the large bridge upstream drainage area (Figure 8).

2 COMMENTS