Build a Frequency Storm in HEC-HMS Using NOAA Atlas 14 Precipitation Depth Data
Similar to SCS Type I, IA, II, and III or other NRCS “nested” rainfall distributions, HEC-HMS frequency storm method provides a way to construct your own “nested” rainfall distributions using precipitation depth-duration data of the same frequency storm (or AEP, annual exceedance probability). In HEC-HMS, the shortest duration is often called the peak intensity duration and usually matches the simulation time interval (Figure 1A).
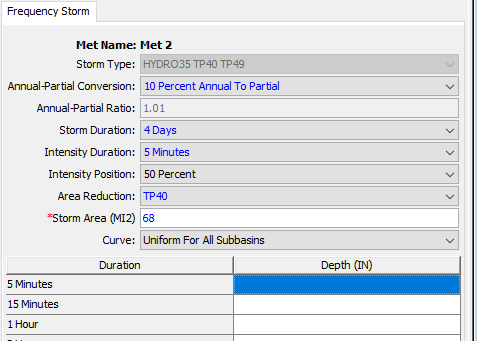
In HEC-HMS, Alternating Block Method (Figure 1B) is utilized to generate a “nested” frequency storm distribution as explained in this post. A “nested” storm distribution is constructed in a way that any shorter duration depths are “embedded” within the design storm duration with the maximum depth increment being placed at the intended peak intensity position. For this reason, a hydrologic model using a “nested” storm distribution, such as HEC-HMS frequency storms, is able to examine the watershed performances under shorter storm durations (up to the storm distribution duration) in a single run.
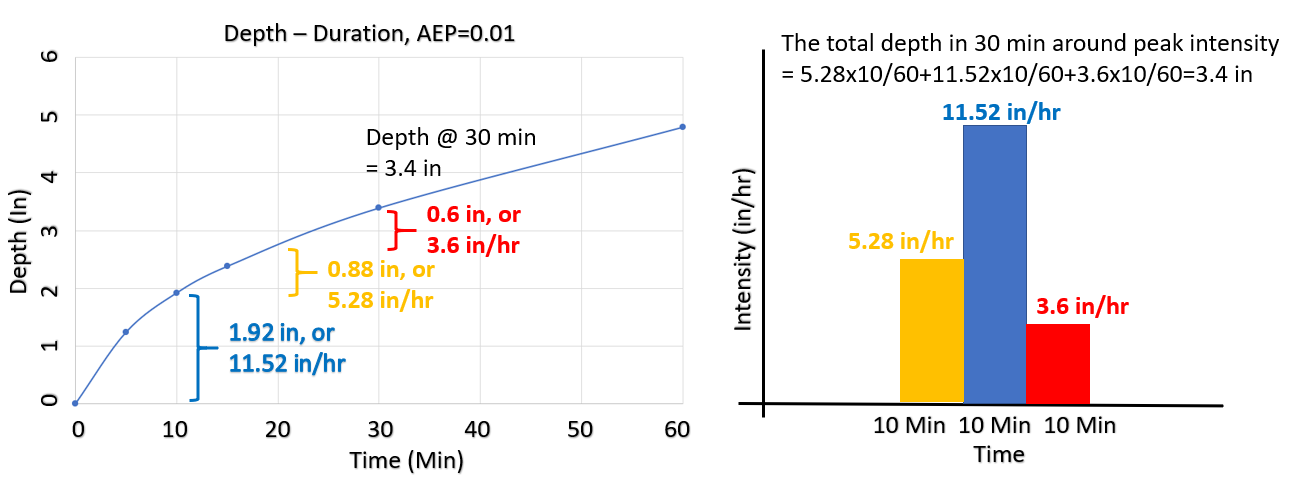
This post provides steps to acquire NOAA Atlas 14 point precipitation depth data of various durations and frequencies. The differences between annual maximum precipitation data and partial duration precipitation data are explained in this post as well. HEC-HMS frequency storm method can convert partial duration to annual maximum data (and vice versa) for 10%, 20%, and 50% events (Table 1). As the annual exceedance probability (AEP) decreases (less frequent than 10-year event), the difference between annual maximum and partial duration data becomes negligible.

To build a 4-day 10 percent (10-year) frequency storm for Austin, Texas using Atlas 14 data, first acquire point precipitation depth data as illustrated in this post. We need annual maximum precipitation depths for various durations up to 4 days for this example (Figure 2).
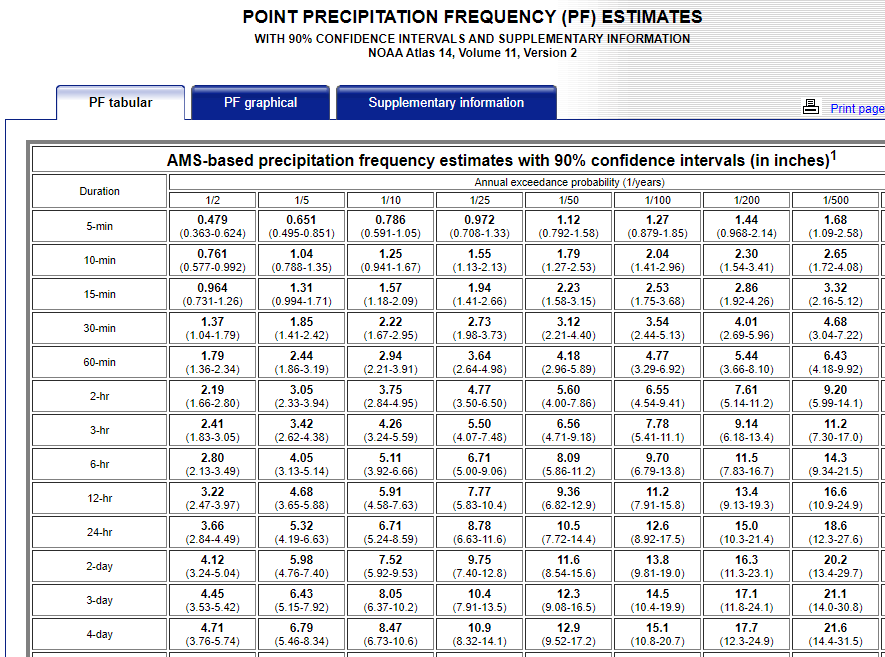
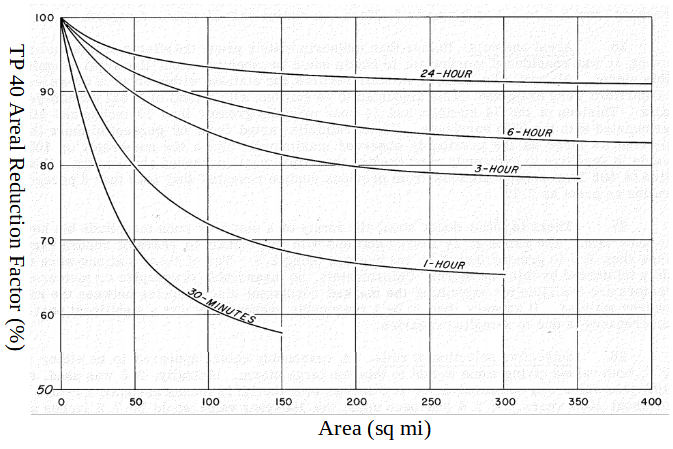
Assume the upstream drainage contribution area of analysis point is 68 sq. mi. and intensity duration is 5 minutes and intensity position is at 50% (48 hr in this example because the total duration is 4-days), we can construct this 4-day frequency storm as shown in Figure 3. For this example, since the precipitation depth is annual maximum series (AMS) based and we want the results to be in reference to partial duration, “10 Percent Annual to Partial” is chosen under “Annual-Partial Conversion” option in Figure 3. You can select “None” for this option if you do NOT want to do the conversion. The Area Reduction method is set as TP40 (Figure 4) and the storm area of 68 sq. mi. is entered. To evaluate another analysis point which has a different upstream drainage contribution area from 68 sq. mi., you will have to build another frequency storm using the correct storm area or utilize the depth-area analysis function of HEC-HMS. If you want to use point precipitation depth data for your model, select Area Reduction as “None”, or type in zero for Storm Area.
The Curve (Figure 3) can be set to “Variable by Subbasin” if a very large watershed is modeled and each subbasin has quite different precipitation depth and duration data. By setting the Curve to “Variable by Subbasin”, a unique set of depth-duration data will need to be typed in for each subbasin.
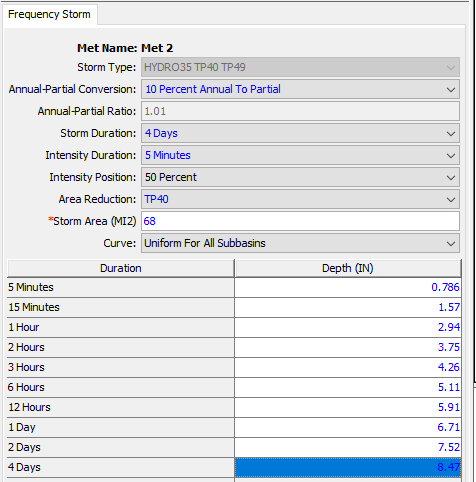
The frequency storm in HEC-HMS is a “nested” storm in which shorter duration precipitation depths are embedded. After converting the HEC-HMS results (of course, using frequency storm method) incremental precipitation depth time series to cumulative precipitation depth time series, it is easy to verify the maximum precipitation depths of shorter duration storms are actually the same values as those entered in the frequency storm method editor in Figure 3.
Some agencies such TxDOT require using annual maximum precipitation data for most analyses and other agencies may prefer partial duration data. HEC-HMS Reference Manual states that the selection of the output type as partial or annual duration depends on the intended use of the modeling results, for example, partial duration output may be appropriate whenever the recovery time is so short that multiple damaging floods may happen within the same year.
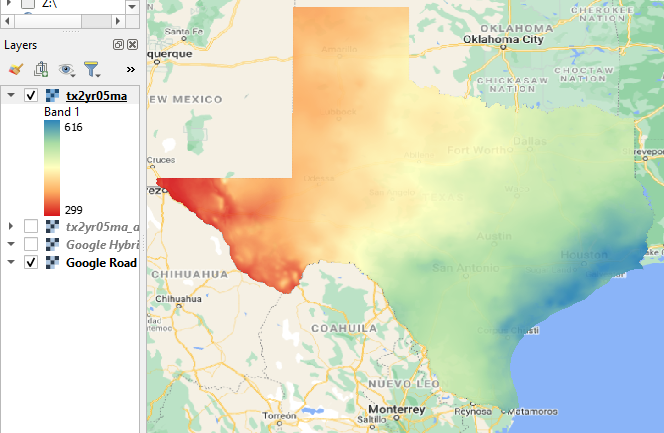
If a watershed is too big where rainfall depth spatial difference must be accounted for, the application of point precipitation depth as illustrated in the frequency storm above becomes inappropriate. NOAA PF Data Server (PFDS) provides precipitation depth raster file in grid format (*.asc) in EPSG 4269 for various durations and AEPs (Figure 5). In the precipitation depth grid files (Figure 6), Atlas 14 depths are stored by taking the floating-point value and multiplying by 1,000. For this reason, in Figure 6, Texas 5-minute duration 2-year storm partial duration precipitation depth ranges from 299/1000 to 616/1000 inch, or 0.299 to 0.616 inch.
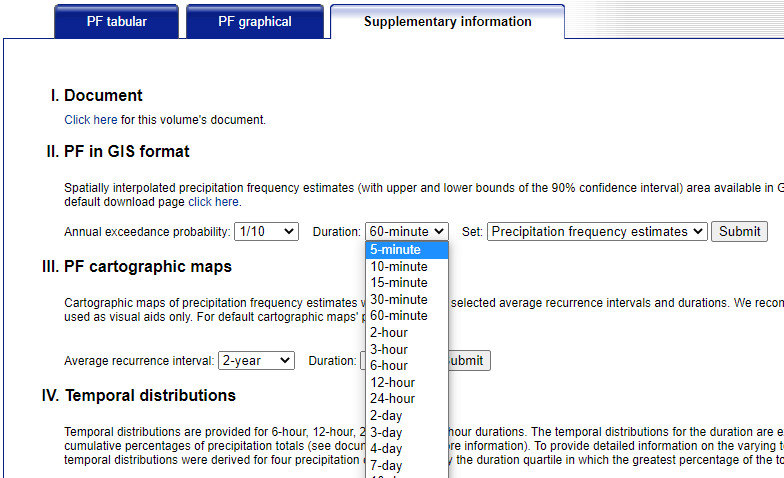
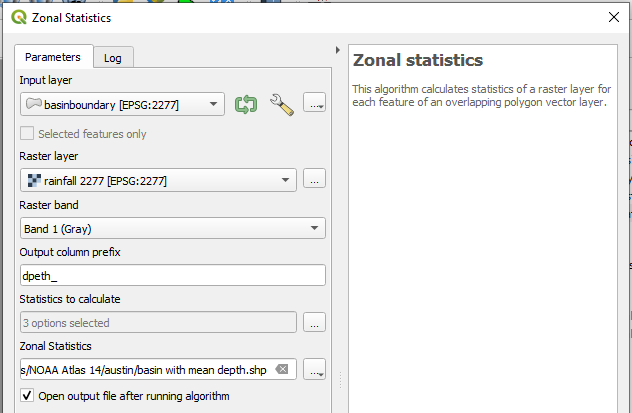
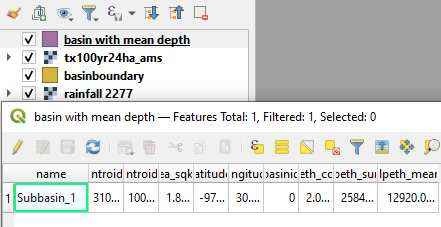
Refer to this post on how to access Atlas 14 point precipitation depth data for your area of interest – select either annual maximum or partial duration time series depending on your need or local codes. Click Supplementary information tab (Figure 5) to download precipitation depth grid files for various durations (5-minute, 15-minute, 1-hour, 2-hour, …), clip them to a little bit larger area than your actual watershed boundary, and re-project to the same CRS of your project files. Next, apply Zonal Statistics function by using the watershed/basin boundary shapefile as input layer and the re-projected precipitation depth raster file as Raster layer (Figure 7) to calculate the area-weighted mean value of precipitation depths within the basin boundary (Figure 8). In the example of Figure 8, the calculated mean value is 12920. Divide it by 1000 and the mean precipitation depth is 12.92 inch within the basin. Repeat the above steps for each individual duration’s precipitation depth grid file to calculate the mean values of other durations. At last, replace point precipitation depth values in Figure 3 with these newly calculated values to build a frequency storm with area-weighted mean precipitation depths.
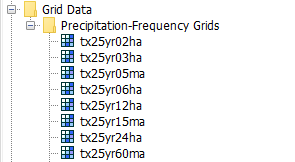
The latest version of HEC-HMS (Version 4.10 or later) supports calculating an average rainfall depth within an entire basin or each individual subbasin for frequency storm method using precipitation-frequency depth raster files. After downloading the required depth raster files for different durations (5min, 15 min, 60 min,…), click File –> Import –> Gridded Data –> Precipitation Frequency… (Figure 9) to import them as Precipitation-Frequency Grids (Figure 10).

Under the Frequency Storm editor, open the Frequency Precipitation Calculator, select a corresponding grid file for each duration, and click the button of “Calculate” to compute basin average (when Spatial Distribution is set as “Uniform For All Subbasins“) or subbasin average (when Spatial Distribution is set as “Variable By Subbasin“) precipitation depths of different durations so a modeler does not need to manually type in these depth values.

Two notes about the precipitation-frequency depth raster files downloaded above:
1. They are simply a collection of point depths at different pixels/locations. The average depth over a basin or subbasin thus is a mean value of point depths. An areal reduction factor is usually needed if the average depth is to be applied to a large watershed (greater than 10 square miles).
2. As the reason mentioned in #1, the precipitation-frequency depth raster files should NOT be interpreted as having any meanings or indications on a storm’s spatial patterns.
2 COMMENTS