Using Frequency Storm for Area-Depth Analysis in HEC-HMS
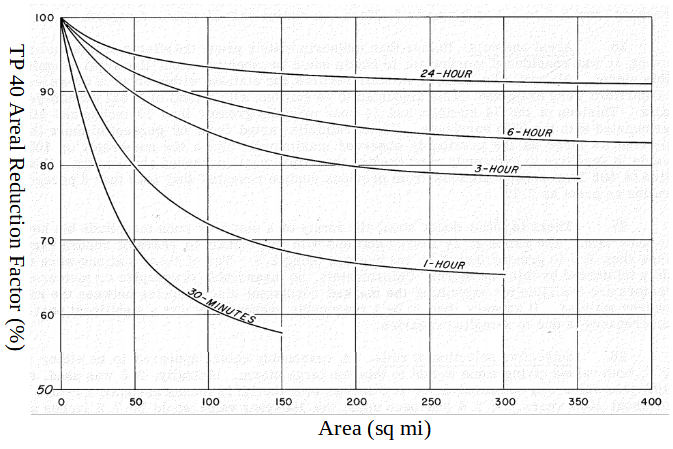
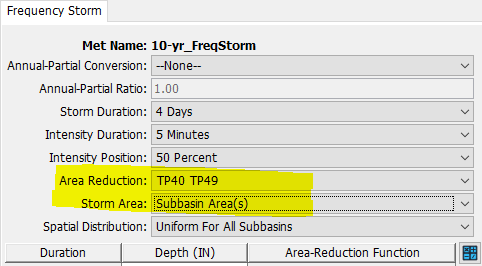
HEC-HMS frequency storm is a type of “nested” rainfall distributions, which can be built by using NOAA Atlas 14 precipitation depth data. If you want to reduce point precipitation depths for a large watershed area (larger than 10 sq mi), there are 2 options to provide a storm area for calculating areal reduction factor (ARF) when choosing TP40 TP 49 area reduction method (Figure 1A) when defining a frequency storm.
Option 1: Subbasin Area (Figure 1B)
This option will use the drainage area of each subbasin to reduce the point precipitation depth, and therefore subbasins with different areas will have different precipitation depths in a single model run. For this reason, only the outflow of each subbasin is useful and meaningful. The combined outflows of two or more different subbasins are NOT making any sense. Use this option if you only care about the outflow of each subbasin.
Option 2: User-Specified Storm Area (Figure 1C)
A storm area needs to be entered and HEC-HMS will apply this value for area reduction factor calculation.
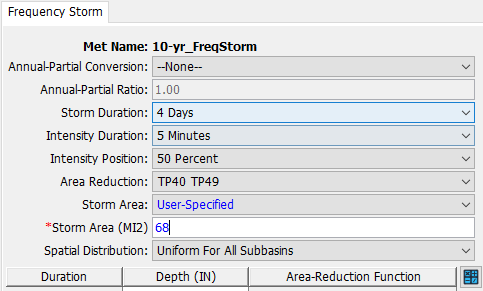
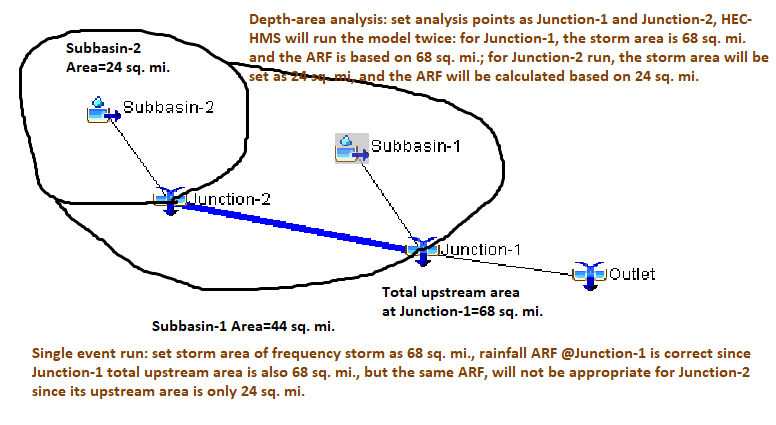
By providing a storm area to a frequency storm, the same precipitation depths, computed by the ARF corresponding to this storm area, will be used to calculate runoff flows for all the subbasins in a model even though some of the subbasins have a smaller drainage contribution area (Figure 2). As illustrated in Figure 2, Junction-2‘s total upstream drainage area is only 24 sq. mi., if you run the model with a frequency storm having a storm area of 68 sq. mil, the ARF is not calculated correctly for Junction-2 (or Subbasin-2). This is not an issue if your evaluation point (analysis point) is at Junction-1; but if you want to evaluate flows at Junction-2, you will have to create another frequency storm with a storm area being set as 24 sq. mi. and re-run the model using this new frequency storm.
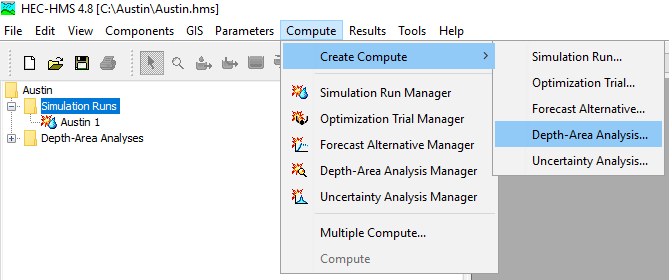
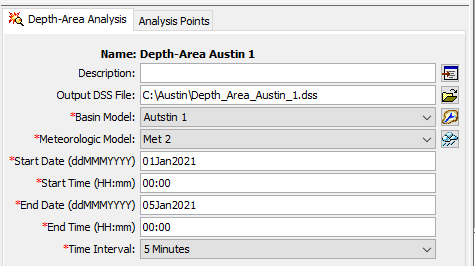
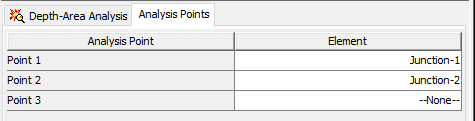
HEC-HMS can automate the above process of running a model with different storm areas corresponding to each individual analysis point (thus different ARF), which is termed as depth-area analysis. To establish a depth-area analysis run, go to Compute—>Create Compute—>Depth-Area Analysis… (Figure 3), provide the analysis with a unique name, and select the basin you want to evaluate. Select the Meteorologic Model and set up the start/end date and time (Figure 4). At last, click the Analysis Points tab of Figure 4 and select hydrology elements as your desired analysis points (Figure 5). For each analysis point, depth-area analysis will run the model respectively using the total upstream drainage contribution area to replace the storm area in frequency storm definition of Figure 1a to calculate ARF.
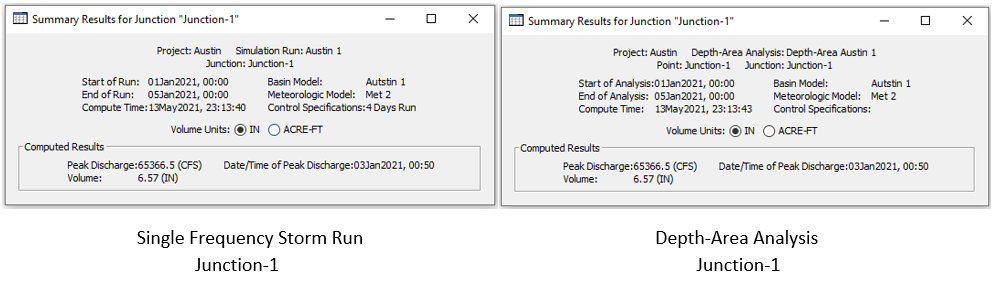
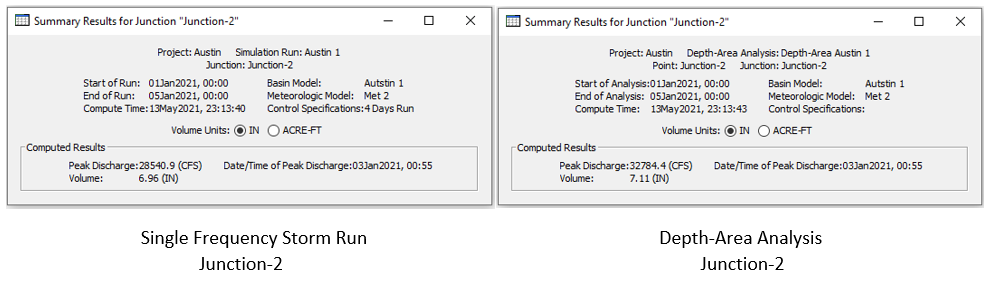
In the example models in Figure 2, Junction-1 has the same peak discharges from the single frequency storm run and depth-area analysis (Figure 6) since both runs use 68 sq. mi. as storm area to calculate ARF. For Junction-2, it is a different story: depth-area analysis run results in a greater peak discharge than single frequency storm run (Figure 7) because depth-area analysis automatically calculate total upstream drainage area of Junction-2 as 24 sq. mil and uses this storm area to calculate a corresponding ARF (ARF of 24 sq. mi. > ARF of 68 sq. mi.),
Leave a Reply