Clark Unit Hydrograph and ModClark Transform Method in HEC-HMS
Clark Unit Hydrograph transform method was originally proposed by C. O. Clark in 1945. Clark Unit Hydrograph embodies two basic features of a watershed (drainage basin) rainfall-runoff process (Figure 1):
- Translation through water movement using time-area method (time-area histogram and time of concentration).
- Attenuation through storage using linear reservoir routing (storage coefficient R).

In HEC-HMS Clark Unit Hydrograph transform method, a built-in time-area curve (Figure 2) is used by default since the HEC studies show that this default time-area relationship represents the temporal distribution adequately for most watersheds.

Time of Concentration (TOC or Tc) in Clark Unit Hydrograph method can be calculated by the methods introduced in this post or be estimated using one of the equations below.
Another parameter required by Clark Unit Hydrograph method is storage coefficient R for linear reservoir routing. Even though R has units of time, the physical meaning of R is an index of watershed storage effect (a larger R means a greater storage effect and thus more attenuation). R is a candidate parameter for calibration, but it also can be estimated based on the results of some studies done in the past.
Fort Bend County of Texas Drainage Manual suggests the following equations to calculate R (Figure 3). The calculated R needs to be adjusted to account for ponding effect by a 2-step adjustment process described by the manual.

USACE Mainstem Columbia River HEC-HMS Model Development Report suggests the following equations to calculate time of concentration and storage efficient R (Figure 4).

Sabol in his 1988 paper of Clark Unit Hydrograph and R-parameter Estimation suggested that R and tc has the following relationship (Figure 5). Example: If a 2.13 square miles watershed has a channel length of 2.84 mile and time of concentration of 2.18hr, its tc/R is equal to 1.13 and therefore R=1.93hr.

Russell in his 1979 paper of Estimating Design Flows for Urban Drainage used the following relationship to estimate storage coefficient R: R/tc=C, where C=8 – 12 for forested watersheds (R/(R+tc)=0.89 to 0.92); 1.5 – 2.8 for rural area (R/(R+tc)=0.60 to 0.74) ; 1.1 – 2.1 for developed areas (R/(R+tc)=0.52 to 0.68).
USGS and Harris County Flood Control District (HCFCD) developed a set of equations to calculate tc and R using Basin Development Factor, or BDF. More details about this method can be found in this post. It is interesting to note that even though tc and R are highly sensitive to BDF, the value of R/(R+tc) is pretty consistent: about 0.73 for low developed BDF, 0.71 for intermediate developed BDF, and 0.67 for high developed BDF. In fact, the average R/(R+tc) probably can be approximated as 0.70 for the entire BDF range of 0 to 12.
HEC-HMS User’s Manual also states that the storage coefficient R, divided by the sum of R and tc, R/(R+tc), is reasonably constant over a region. R/tc may range from 0.3 to 10 or more depending on watershed characteristics, and correspondingly R/(R+tc) is between 0.23 to 0.91. You may assume R/(R+tc)=0.7 or 0.5 as a starting point if you don’t have other ways to get an initial R value, and it is suggested to validate this initial R value if possible.
Clark Unit Hydrograph Method introduced above is a lumped rainfall-runoff transform method. In order to better model a watershed’s spatial (geographic) variations of characteristics, Clark Unit Hydrograph is modified in HEC-HMS to represent a watershed by a grid system consisting of square-shaped grid cells. The modified Clark Unit Hydrograph method is named as ModClark, a distributed (or quasi-distributed more accurately) rainfall-runoff transform method.
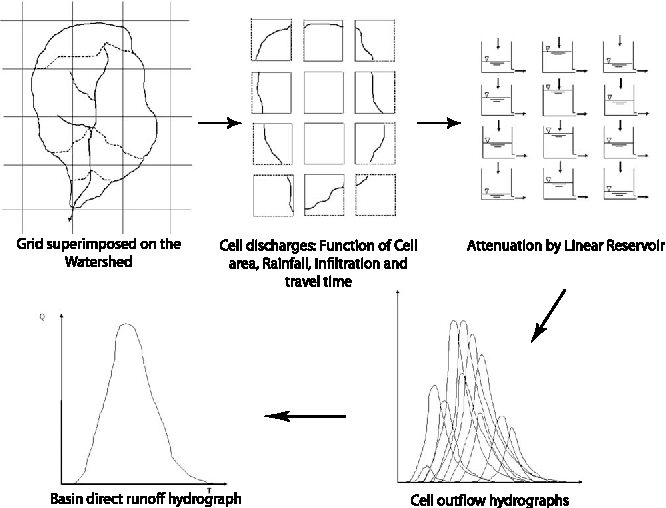
Similar to Clark Unit Hydrograph, ModClark method also explicitly account for translation and attenuation/storage. For storage effect, ModClark employs the same parameter of storage coefficient R as Clark Unit Hydrograph does, however, ModClark does NOT need a time-area curve for translation. In ModClark each cell represents a small sub-watershed and the travel time is calculated separately based on its distance to the watershed outlet and the watershed time of concentration (Figure 6).

In ModClark, each cell’s individual runoff hydrograph is translated to watershed outlet and at there it is routed by linear reservoir to account for storage effect. At last, the overall watershed runoff hydrograph is created by combining all the individual cell hydrographs (Figure 7).

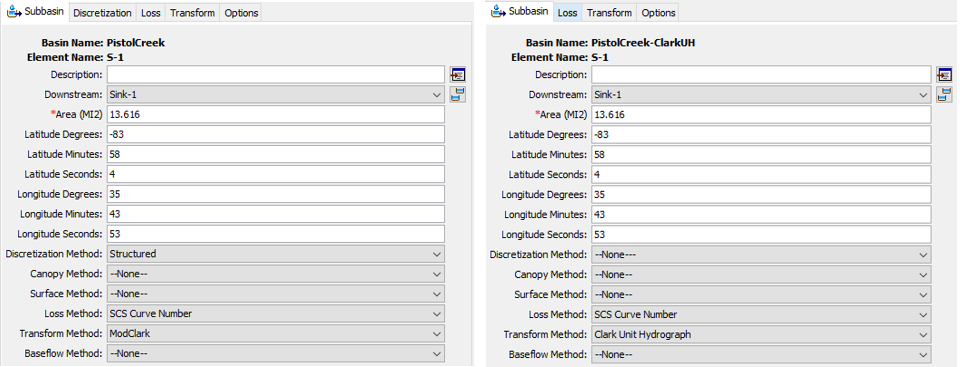
ModClark transform method requires subbasins to be discretized using “Structured Discretization” method which usually uses SHG grid system in HEC-HMS (refer to this post for more details about SHG and Structured Discretization). In this example project (download HEC-HMS model zip file here), two identical basins are present except that Basin of PistolCreek (Figure 8) uses ModClark transform method (tc=6hr, R=8hr) with SHG grid cell size as 50-meter x 50-meter, and the other basin (Basin of PistolCreek-ClarkUH – Figure 8) uses Clark Unit Hydrograph transform method (tc=6hr, R=8hr, and the default time-area relationship). Both basins uses SCS Curve Number (average CN=77.53 for the entire basin) as loss method (refer to this post for gridded SCS Curve Number loss method working together with ModClark transform).

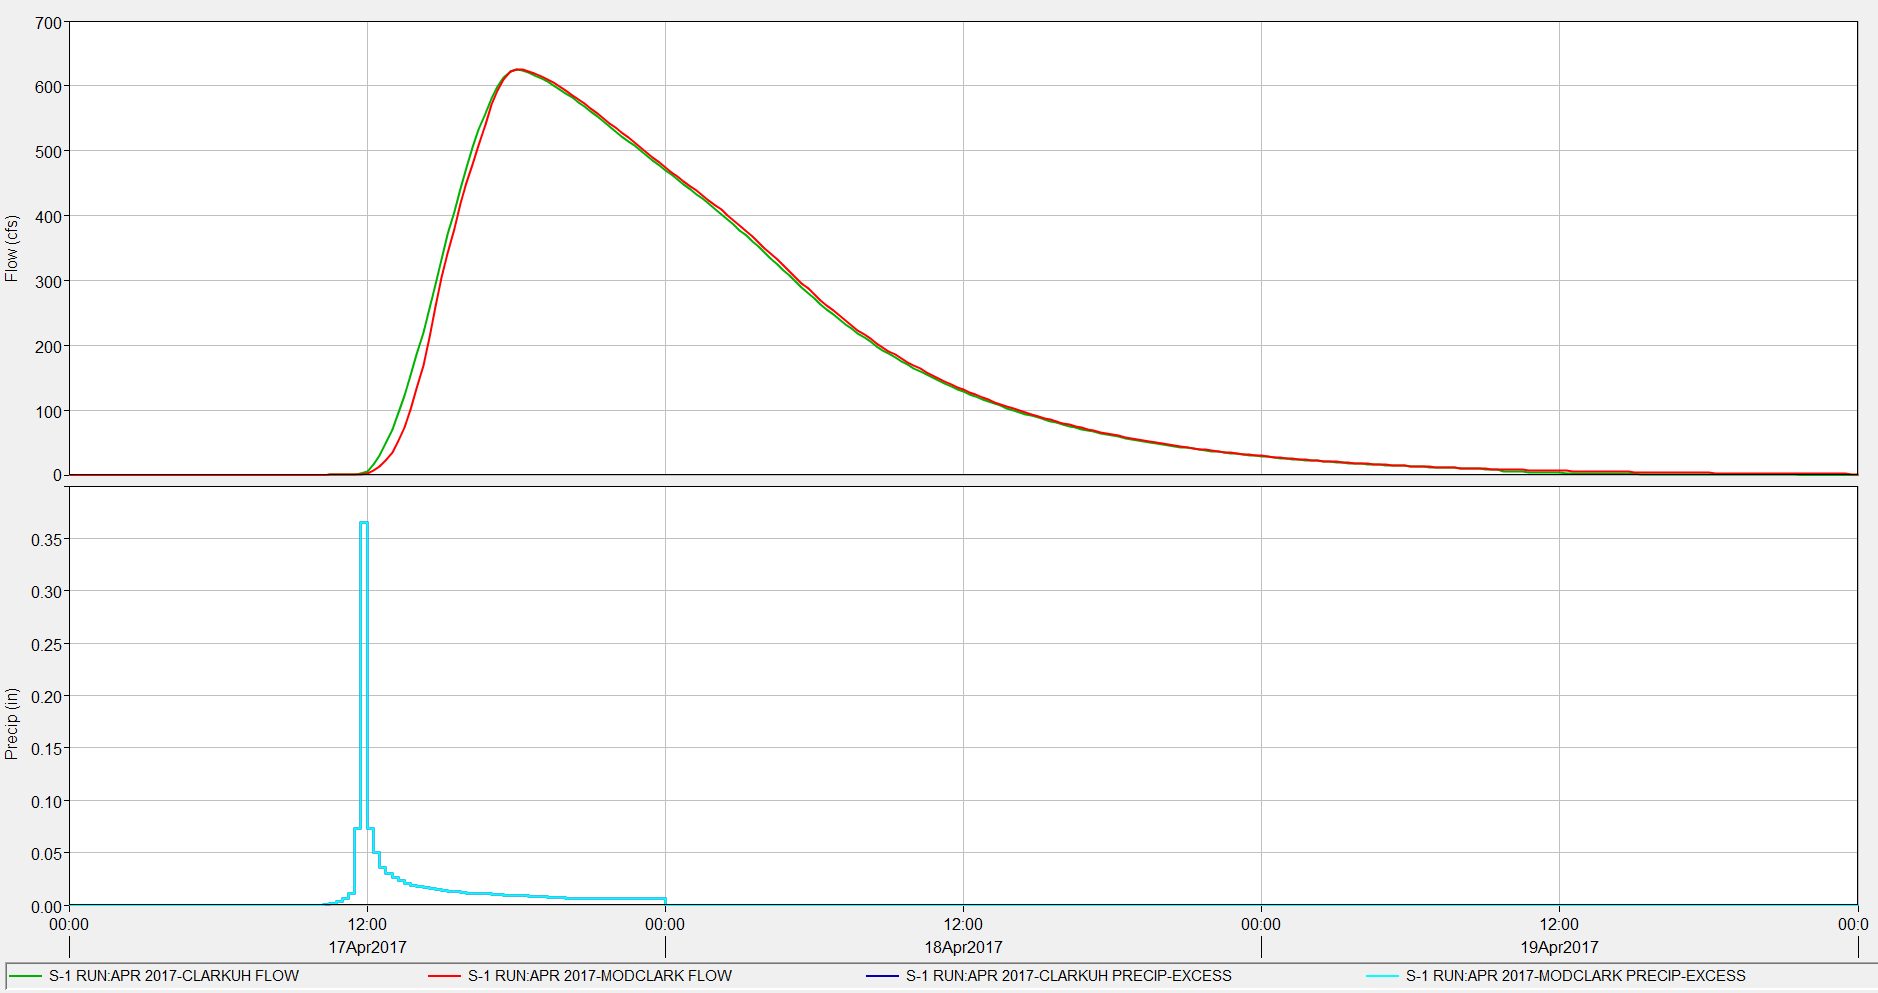
The outflow hydrographs of the two basins are very close (Figure 9) and the peak flows are almost the same: Q-peak of ModClark method is 625.2 cfs and Q-peak of Clark Unit Hydrograph method is 624.5 cfs.

Leave a Reply