Manning’s n (Roughness Coefficient) for HEC-RAS 2D Modeling
In HEC-RAS 2D modeling, manning’s n values (Roughness Coefficient) for 2D flow area are normally associated with land cover types and used to account for energy friction losses of overland flow and/or channel flow (if channel flow is also modeled by 2D domain). The factors impacting manning’s n values for 2D modeling include overland surface type and texture, pervious or impervious areas, 2D flow depth. A lot of researches have been done to study Manning’s n values in 1D channel but not so many for Manning’s n values in a 2D domain.
Manning’s n values for 2D modeling should be a little bit less than those used for 1D modeling for the same types of land covers. In an 1D model the Manning’s n has to account for certain types of losses that are not included in 1D equations such as turbulence, but a 2D model is able to represent these types of losses explicitly. It is hard to quantify the reduction ratios, but a presentation by Michael Baker suggests a typical 1D Manning’s n may need to be reduced by 15% to 30% when used for HEC-RAS 2D modeling to achieve comparable results.
This post intends to provide some general guidelines on initial selection of manning’s n values for HEC-RAS 2D modeling. It should be noted that the Manning’s n and Percent Impervious provided in this post are subject to further examination by the modelers and they shall be calibrated whenever it is possible. For how to establish Land Cover Layer and edit Manning’s n value in HEC-RAS using RAS Mapper, please refer to this post.
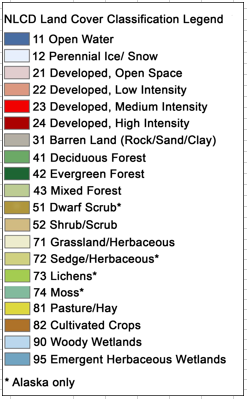
In HEC-RAS 2D modeling, it is common to associate manning’s n values with certain types of land cover (https://www.mrlc.gov/). As shown in Figure 1, in NLCD, different land cover types are indexed by numerical values.
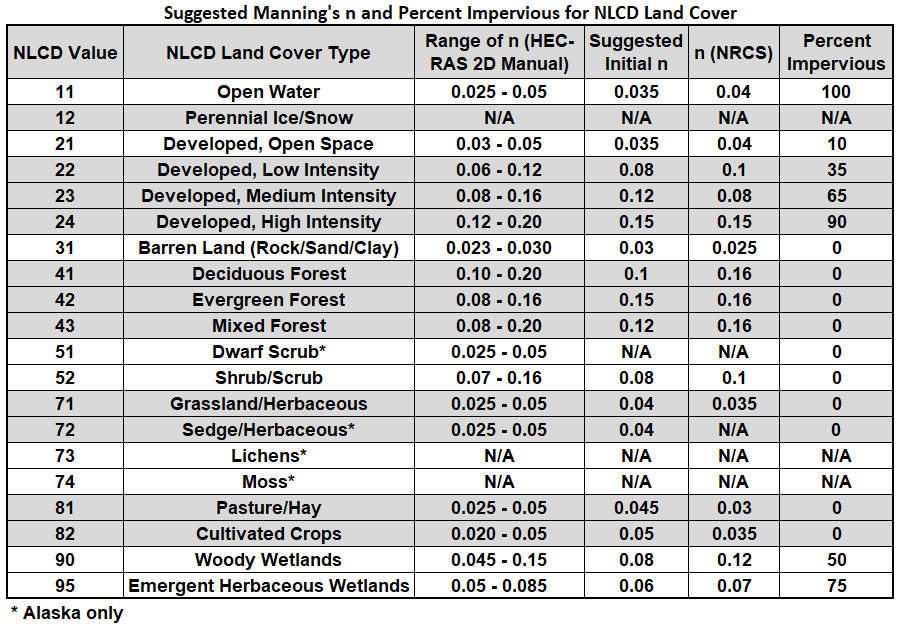
Both HEC-RAS 2D Manual and NRCS of USDA provided an estimate of manning’s n value for each NLCD land cover type and they are summarized in Table 1. HEC-RAS 2D User’s Manual and its example projects also list some suggested values for Percent Impervious for different NLCD land cover types (Table 2A). Percentage of Impervious is only used when you use precipitation and infiltration features of HEC-RAS (rain-on-grid). No infiltration will occur on an impervious land surface.
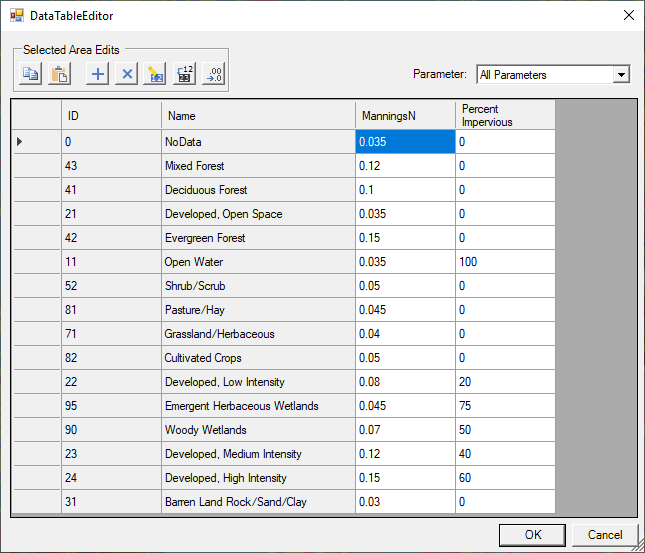
Another example project from HEC-RAS 2D installation, Muncie, uses a different set of land cover types and manning’s n values which are summarized in Table 2B.

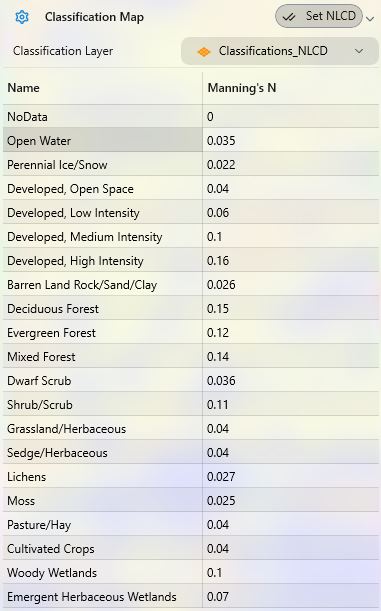
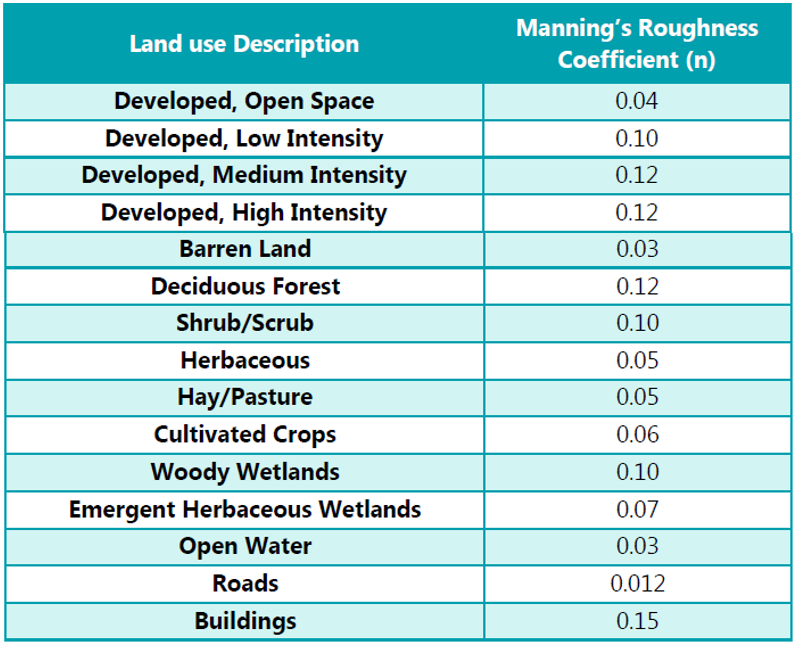
HEC-RAS 2025 has the capability to download NLCD Data Set and re-classify it as Manning’s N Values Layer. The following Manning’s N values are automatically filled in by HEC-RAS 2025 (Figure 2C).
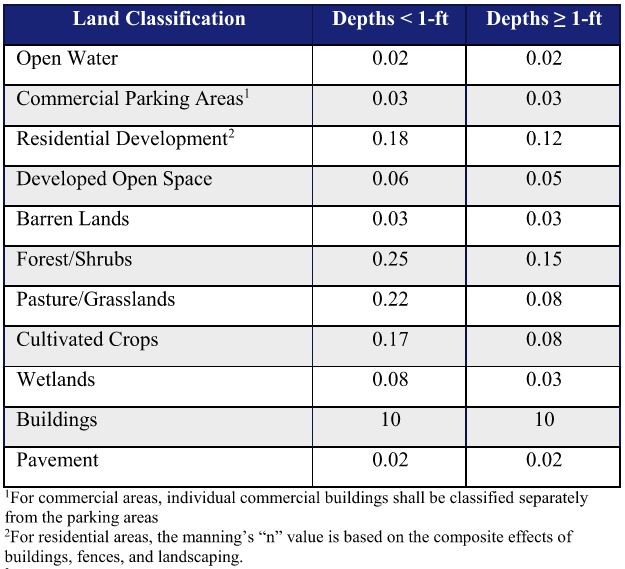
Montgomery County of Texas published a table of 2D Modeling Manning’s n in the draft Drainage Criteria Manual, February 2024 (Table 2D).
The College Creek Floodplain Study done by Alfred Benesch & Wood in 2019 used the following Manning’s n values in Table 3. The Manning’s n values in Table 3 are in good accordance with those in Table 1 or Table 2A.
NOAA developed a nationally standardized land cover for the coastal areas of the U.S. through the Coastal Change Analysis Program (C-CAP). The latest 2016 C-CAP data in raster format can be downloaded from NOAA C-CAP website. There are not a lot of documentations on how to assign Manning’s n and percent impervious values to different C-CAP land covers. Nonetheless, a table (Table 4) is developed by comparing NLCD and C-CAP land cover types and borrowing Manning’s n values from Table 1.

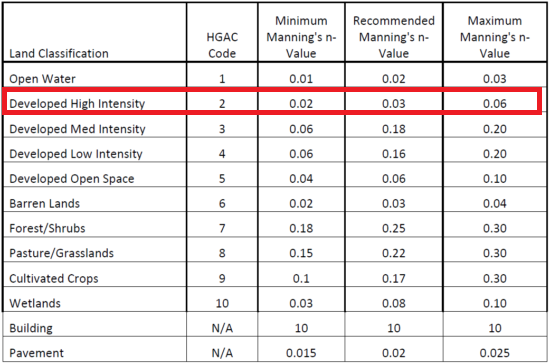
Harris County Flood Control District (HCFCD) 2D Modeling Guidelines for Site Development suggests Manning’s n values with a 2D domain as shown in Table 5. The Manning’s n value is only 0.02 to 0.06 for Developed High Intensity because it does not include the effect of building structures. For HCFCD HEC-RAS 2D modeling projects, building footprints should be imported for Developed High Intensity land classification areas to override Manning’s to 10 to effectively remove conveyance through buildings.
Amite River Basin Numerical Model Report prepared by Dewberry for Louisiana DOTD uses Manning’s n shown in Table 6. In Table 6, The NLCD Code of Shrub/Scrub should be 52 instead of 51 which might be a typo of the report. The Manning’s n values in Table 6 generally fall within the ranges suggested by HEC-RAS 2D User’s Manual with the exceptions of 21 – Developed, Open Space, 31-Barren Land (Rock/Sand/Clay), 81 – Pasture/Hay, and 82 – Cultivated Crops: these land cover types’ Manning’s n is much higher as listed in Table 6.

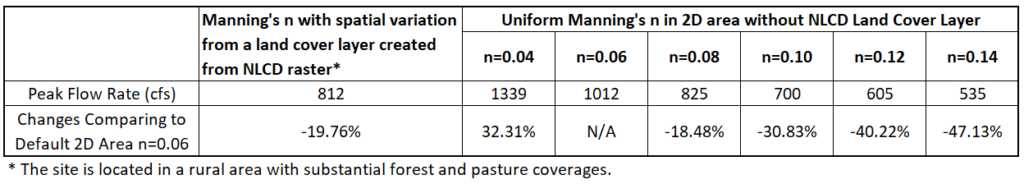
A sensitivity analysis on Manning’s n impact on peak flow rates was conducted for a RoG HEC-RAS 2D model and the results are presented in Table 7. These results are of course not conclusive.
A Youtube channel (@HEC HUB) did a Manning’s n sensitivity analysis for a 2D flow area of about 1.8 sq mi. HEC HUB compared the peak flows at the outlet of the 2D flow area for two scenarios: 1. Manning’s n based on NLCD raster file; 2. Manning’s n based on NLCD raster file plus channel Manning’s n override. The peak flow of Scenario 1 is 2991cfs while the peak flow of Scenario 2 is 3510cfs, 17% higher. The Scenario 1 river WSE is higher than Scenario 2’s and the difference is anywhere between 0.0 to 0.8 ft.
Leave a Reply