Peak Flow Validation
Peak flows of different frequencies calculated from hydrologic modeling often need to be validated to gain some confidence on them. There are several ways to validate a peak flow value.
- 1. Using the Results from Previous Studies
It is possible the watershed you are currently working on has been studied before by others such as FEMA (flood insurance study, for example), USACE, NRCS, state DOT, local drainage districts and departments of public works. Contact these government agencies to acquire the study reports and models and use their results as a reference to evaluate your values.
- 2. Using USGS or Local Regression Equations
USGS or local regulating agencies may have developed regression equations to estimate peak flows of various flood frequencies. For Texas, the regressions equations for undeveloped watersheds are presented in the USGS Report SIR 2009-5087 (Figure 1) and for Louisiana, the regressions equations can be found at Methods for Estimating Flood Magnitude and Frequency in Rural Areas in Louisiana 2001.
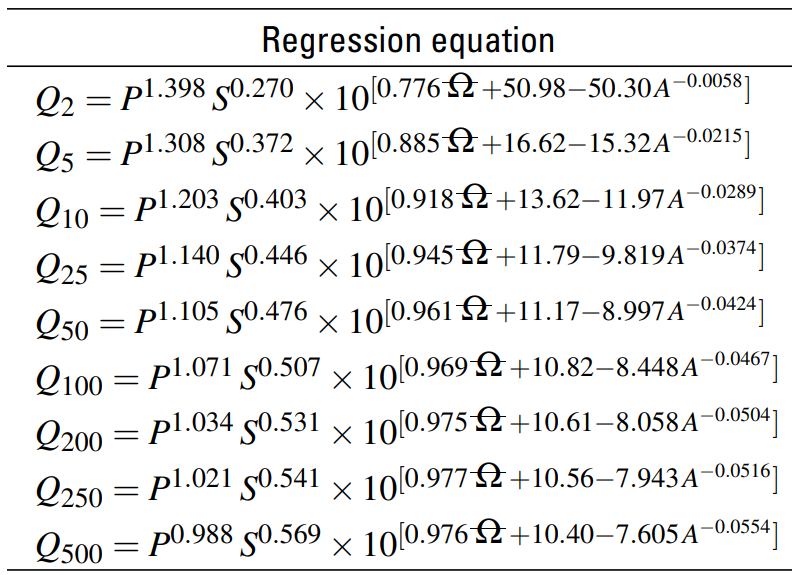
Normally these regression equations require variables such as watershed area, main channel slope, mean annual precipitations, and others, and they can be easily solved by a spread sheet. Most of the regression equations were originally developed for rural watersheds, and an urbanization correction is needed for urban watersheds. Basin Development Factor (BDF) is an important urbanization index and is often being used to adjust a rural peak flow for urban area. BDF was first introduced in a 1983 USGS study titled of Flood Characteristics of Urban Watersheds in the United States and is explained in this post.
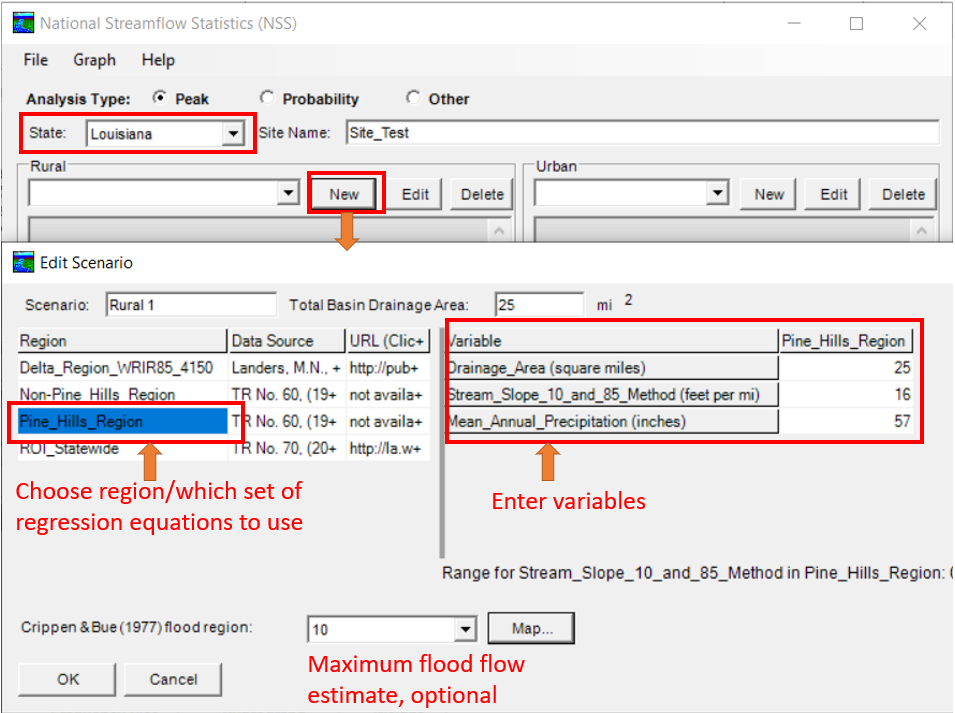
USGS developed a software tool named National Streamflow Statistics (NSS) to aid the regression equation calculations. NSS is straightforward to use: after opening the software, choose a state, and start a new calculation window for rural or urban depending on the project location. After supplying the required variables, peak flows of different frequencies are calculated and displayed by clicking OK button in Figure 2. In order to calculate peak flows of a urban watershed, you may need to do a calculation for rural first and only after the rural calculation is done, you can start a new calculation session for urban which will apply the appropriate urbanization corrections.
- 3. Using USGS PeakFQ
USGS Program PeakFQ is a tool to perform flood-frequency analysis on stream flow gage records by following Bulletin 17B/17C procedures and provide estimates of peak flows for a range of annual exceedance probabilities (AEP, return periods, or frequencies).
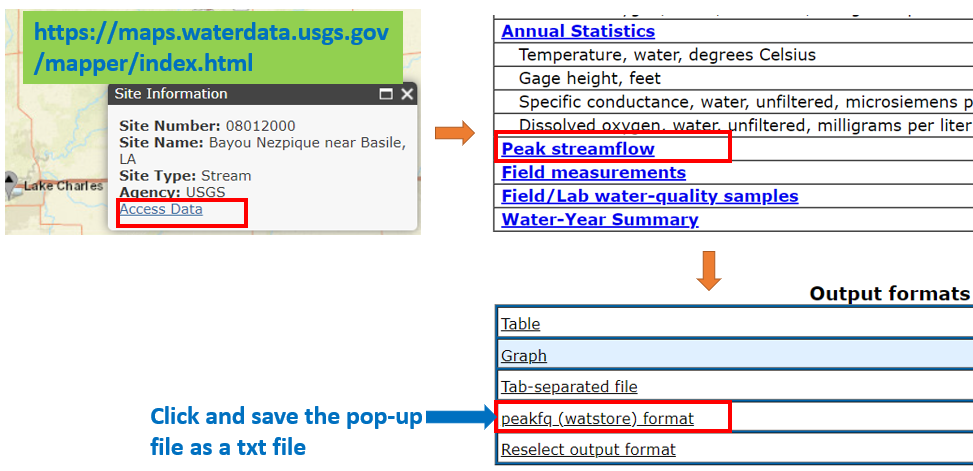
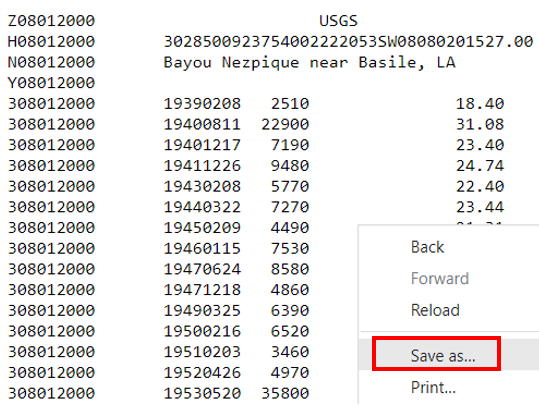
To start, download a streamflow gage records file in watstore format from National Water Information System (NWIS) Online Mapper by selecting the gage of interest (Figure 3). Save the file that pops up at the end as a txt file (Figure 4) , which is to be used as the input file of PeakFQ.
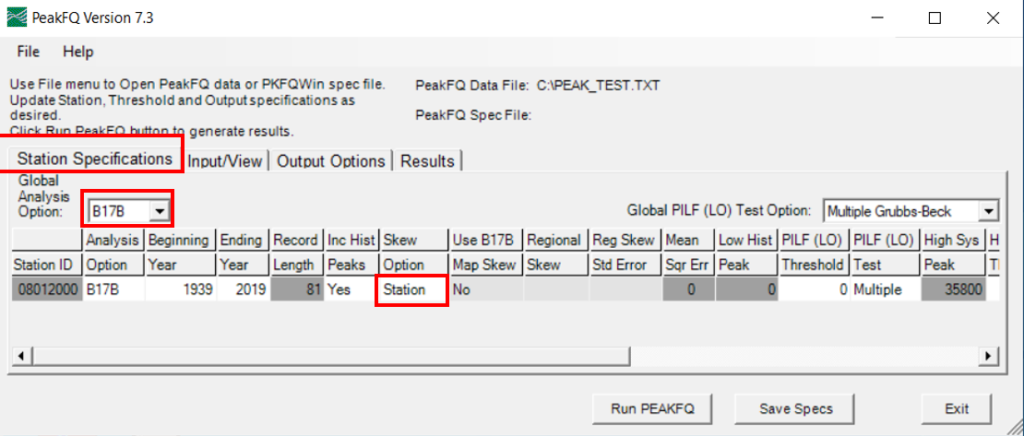
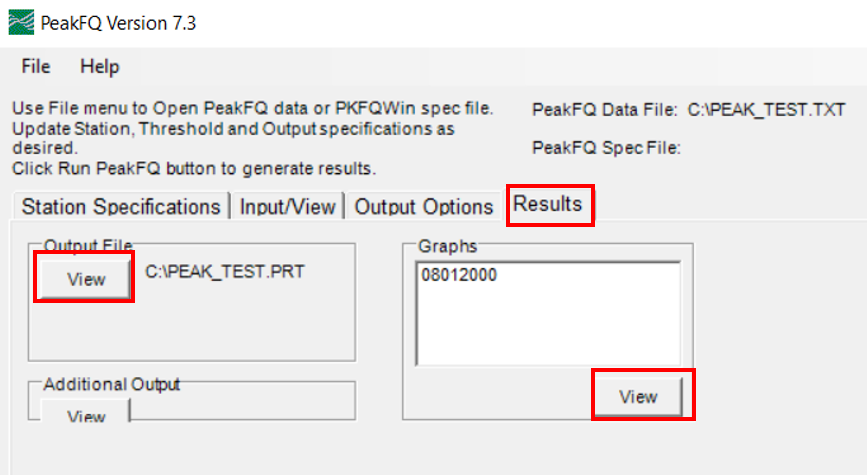
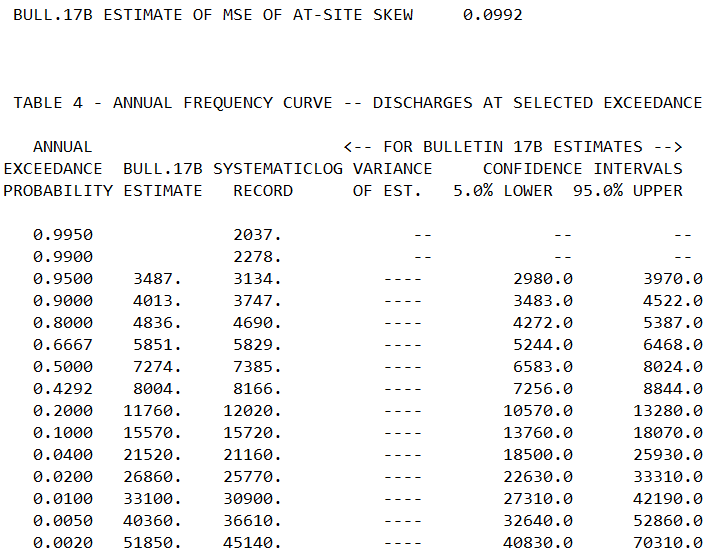
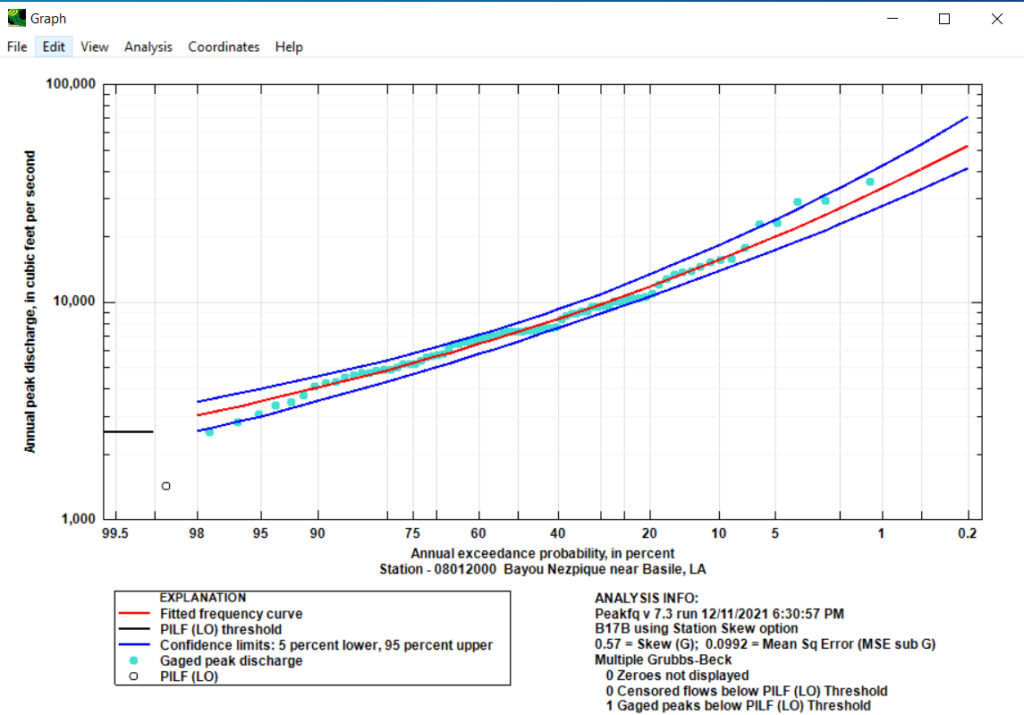
Open the saved PeakFQ input txt file and make sure the settings are appropriate for your analysis (Figure 5). After click the “Run PEAKFQ” button the Results tab becomes current (Figure 6). The results can be viewed graphically (Figure 7) or in the output file (*.PRT) (Figure 8).
- 4. Transposition of Peak Flows
USGS Program PeakFQ is a useful tool but quite often there is no stream flow gage data at the point of interest to perform a flood-frequency analysis. In this situation, if a peak flow-frequency analysis can be performed at a nearby gage, then the peak flows at the point of interest can be estimated by transposing values at the gaged location (Figure 9). Peak flows from a previous drainage study can also be transposed to another location of point of interest. Transposition of gage analysis or previous study results is appropriate for hydrologically similar watersheds and preferably, the two watersheds should have a similar drainage area magnitude and be located close to each other.
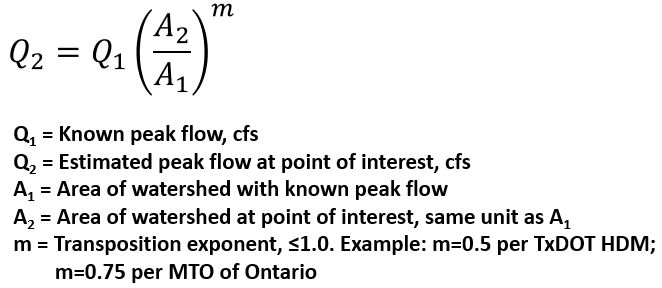
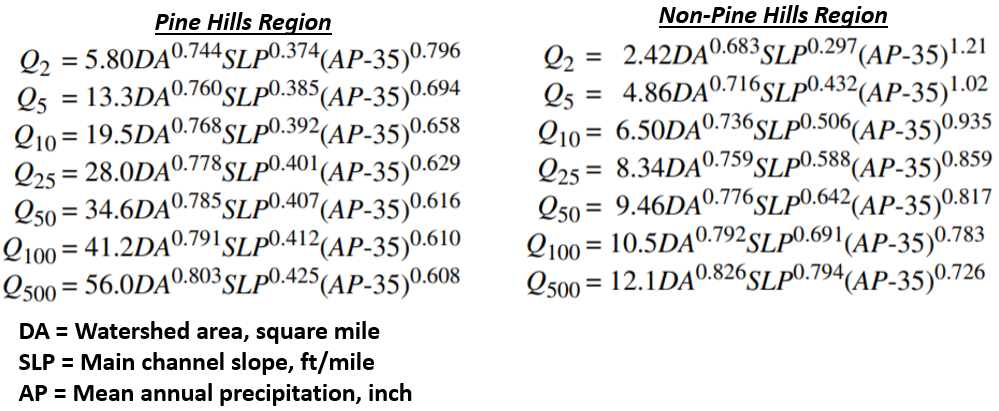
In the equation of Figure 9, the transposition exponent m is a constant whose value depends on different regions and studies. FHWA HDS-2 suggests m to be taken as the exponent of watershed area in the regional peak flow regression equations. For example, the State of Louisiana has USGS peak flow regression equations as shown in Figure 10. To transpose a 100-yr peak flow, the m value may be assumed to be 0.791 in Pine Hills Region, or 0.792 in Non-Pine Hills Region.
Leave a Reply