Recondition And Pre-processing DEM For A Better Watershed Delineation
A DEM, before it can be used for watershed delineation, often needs to be reconditioned and pre-processed by “filling” any depressions or sinks (an area lower than its surroundings) to create a hydraulically connected and filled DEM. Sometimes the operation of filling depression will significantly change the original DEM by filling too large or too deep an area, which may cause an issue to the following watershed delineation.
A lot of hydrologic modeling and GIS tools have the capabilities to recondition and pre-process a DEM, including HEC-HMS, TauDEM, SAGA, and Whitebox Tools. This post is to introduce ACPF Toolbox developed by The Agricultural Conservation Planning Framework (ACPF), which is relatively unknown among the H&H modeling community. As its name suggest, the ACPF Toolbox is mainly for agricultural conservation planning purpose, however, some of its tools can be borrowed to re-condition a DEM for better watershed delineation.
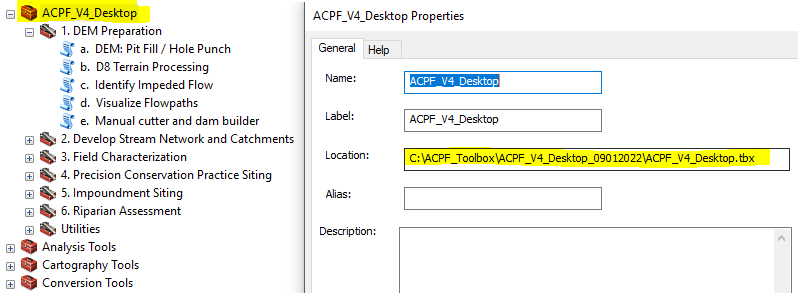
Download the ACPF Toolbox zip file from here and extract all the files to a local folder. Open ArcMap ArcToolbox to add ACPF Toolbox by navigating to the folder where ACPF_V4_Desktop.tbx resides (Figure 1). Some of the ACPF tools are depending on TauDEM so TauDEM needs to be installed together with ACPF Toolbox.
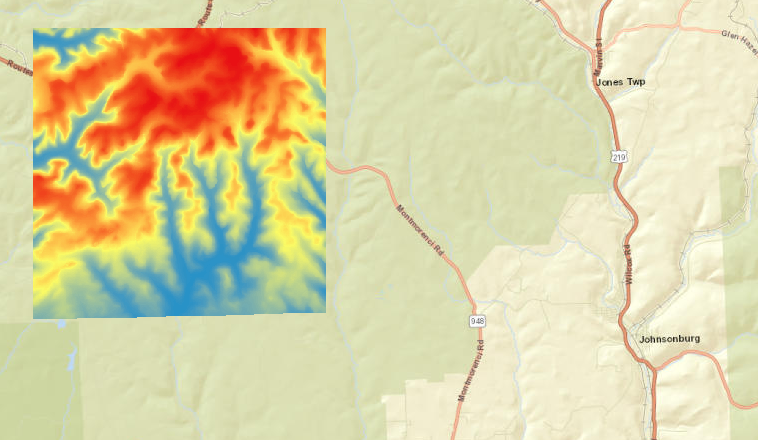
Using Bear Creek Watershed as an example, this post is to demonstrate how to recondition a DEM by cutting (stream burning) in ACPF Toolbox. Bear Creek Watershed is about 9 miles west of Johnsonburg, PA (Figure 2) and the files used for this demonstration can be downloaded here including the re-projected DEM file Bear Creek EPSG26917 ft.tif and the cut line shapefile.
ACPF Tool 1.a DEM Pit Fill / Hole Punch is optional and it is skipped in this example.
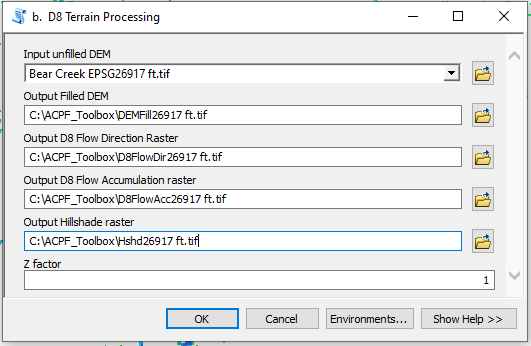
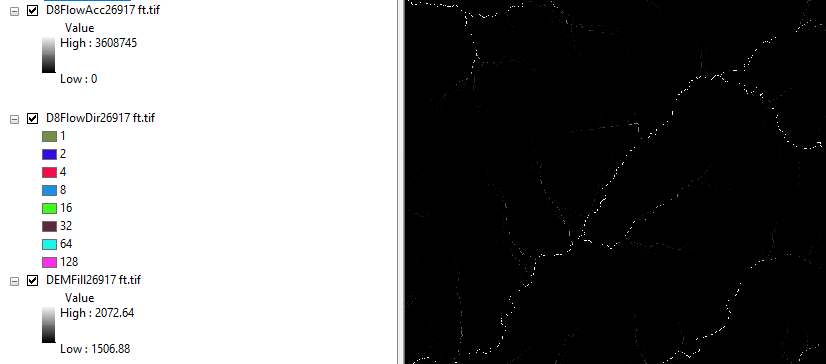
ACPF Tool 1.b D8 Terrain Processing is to create an filled DEM, a D8 Flow Direction raster file, a D8 Flow Accumulation raster file, and a Hillshade raster file from an unfilled DEM (Figure 3 and Figure 4). It appears that ACPF is calling the corresponding tools under Spatial Analyst Tools of ArcGIS to complete this task. The output files of Tool 1.b are for interim use purpose only, and instead, the ones from Tool 1.e should be used for final hydrologic processing.
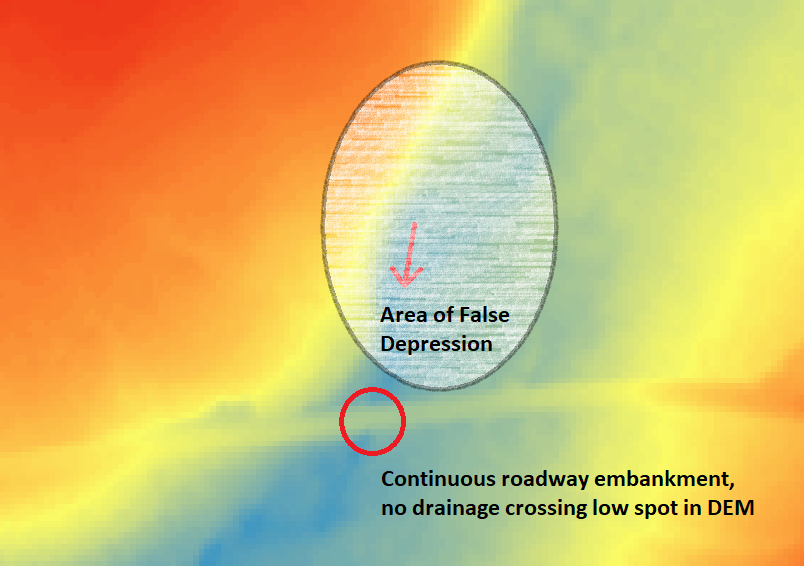
During watershed delineation, depressions in a DEM will be filled up so water will continue to travel downstream. Some depressions are natural features and they should be filled to conduct a successful watershed delineation, however, there are also “False Depressions” which are deemed as depressions by GIS due to poor DEM quality but should not. An example of “False Depressions” is the filled-up area upstream of a bridge or culvert since the DEM does not pick up the drainage crossings (Figure 5). It is probably impossible or unnecessary to correct every single false depression in a DEM, and instead, a modeler’s attention should be paid to the ones having a major impact on watershed delineation and flow path identification.
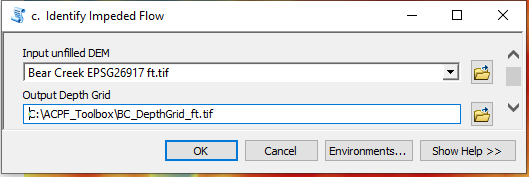
ACPF Tool 1.c Identify Impeded Flow is meant to help a modeler identify “false depressions” by calculating the elevation differences between filled and unfilled DEM. The input file of Tool 1.c is an unfilled DEM as illustrated in Figure 6.
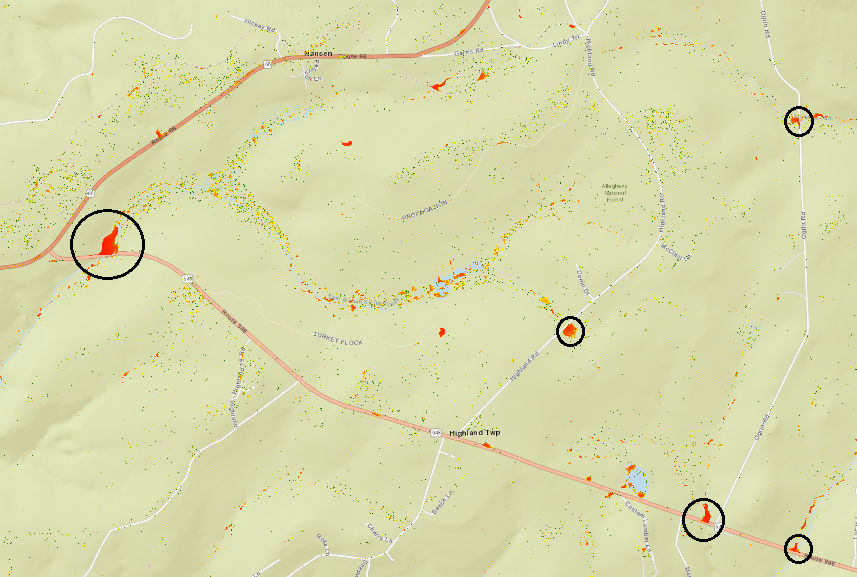
As mentioned above, when modifying a DEM a modeler should focus on areas along major flow paths or having a major impact on hydrology analysis such as the depressions circled in Figure 7.
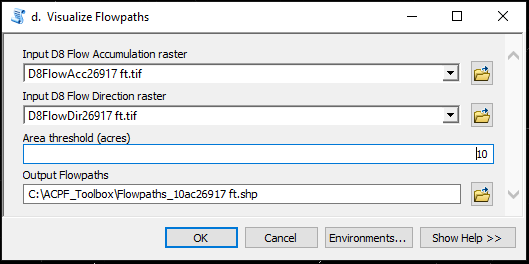
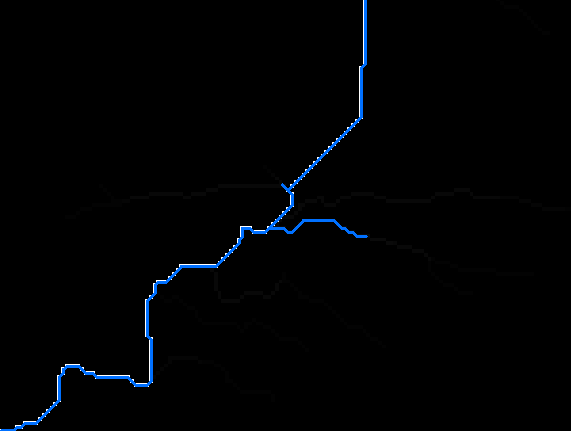
ACPF Tool 1.d Visualize Flowpaths is to create a flowpath shapefile (stream network) using the flow accumulation and flow direction raster files from Tool 1.b (Figure 8 and Figure 9). The area threshold value is entered as 10 acres in this example after trial and error.
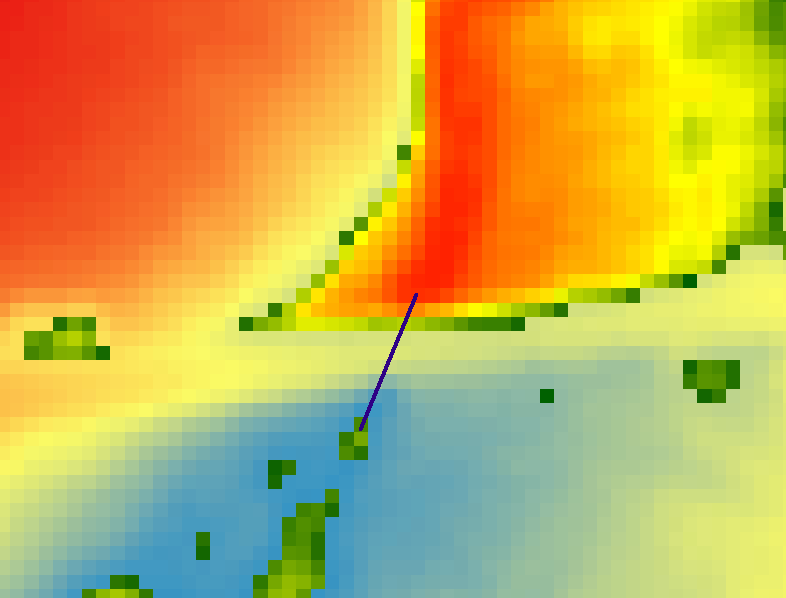
A line shapefile needs to be created as cut lines to modify DEM to eliminate false depressions. Different files can be utilized to locate a cut line’s location, begin and end points and these files include the output files from Tool 1.c and 1.d, aerial images, google map and USGS topographic maps. In Figure 10, a cut line was drawn by connecting two low points on each side of the roadway. The low points usually have a larger pixel value in the 1.c output raster file.
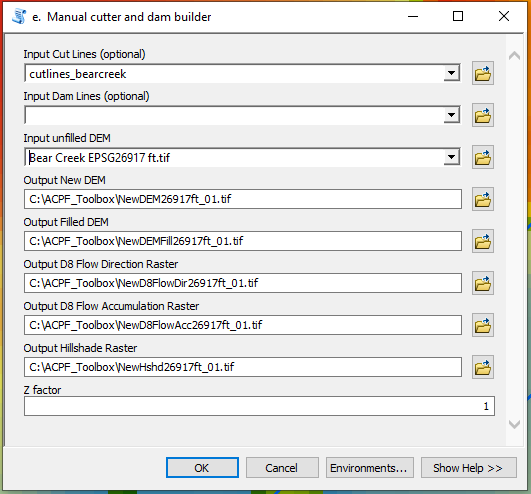
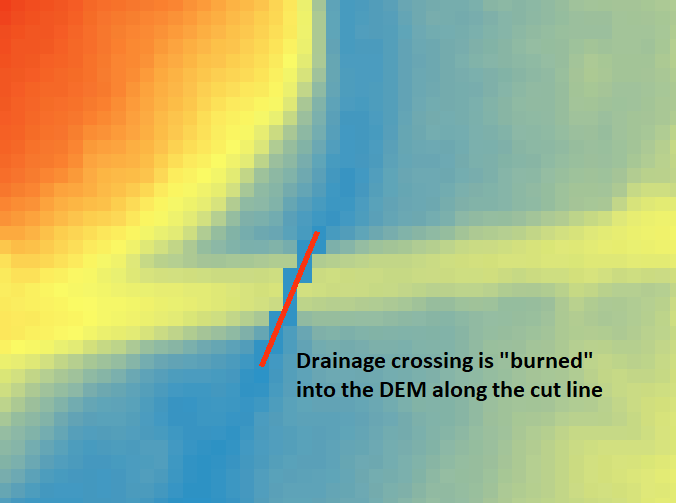
Run ACPF Tool 1.e Manual cutter and dam builder to modify the DEM in hopes of eliminating false depressions (Figure 11). The input files are the cutline shapefile created above and the original unfilled DEM. Tool 1.e output files include a new DEM (cut, but not filled), a new filled DEM (cut and filled), and flow accumulation and flow direction raster files which are based on the new filled DEM (Figure 12 and Figure 13).
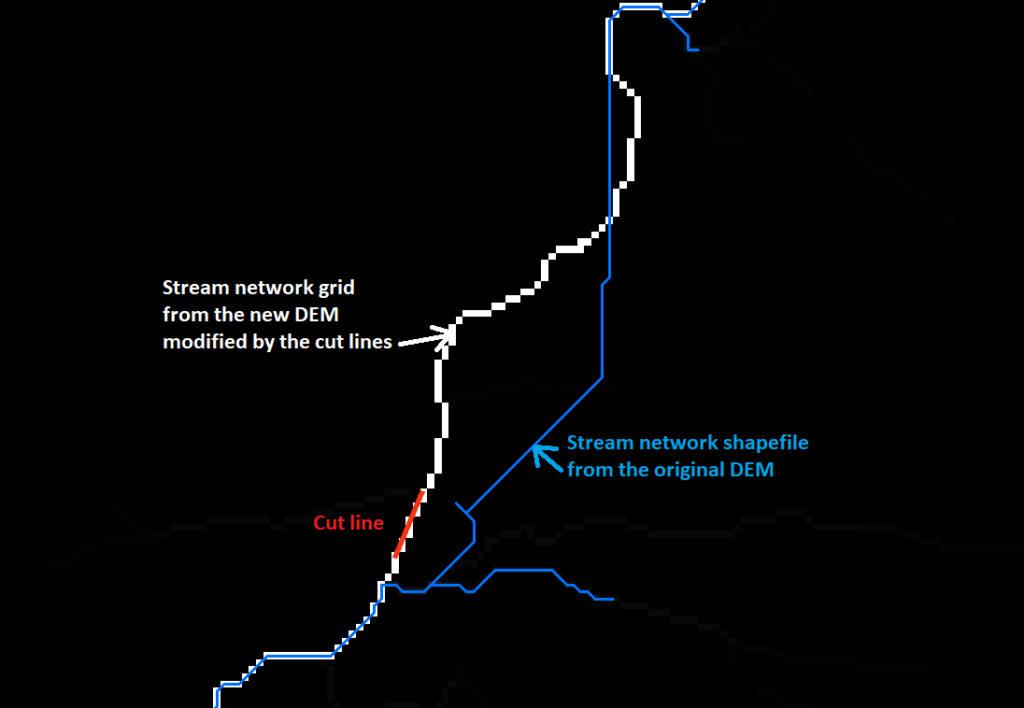
ACPF Tool 1.e is an iterative process, which means you may need to re-run it several times by using different cut/dam lines before getting a satisfying new DEM. Also, it should be noted that for each run, the Input unfilled DEM should always be the same original unfilled DEM. Once you get what you like, use the final output files (new DEM, new filled DEM, and new flow accumulation and flow direction raster files) for watershed delineation and other hydrologic analysis processes.
Finally, keep it in mind that too many or too poorly placed cut/dam lines may have unexpected consequences on your hydrologic analysis results, and for this reason modifications to the original DEM should be limited to as few as possible.
Leave a Reply